GET MORE FROM EVERY ASSAY
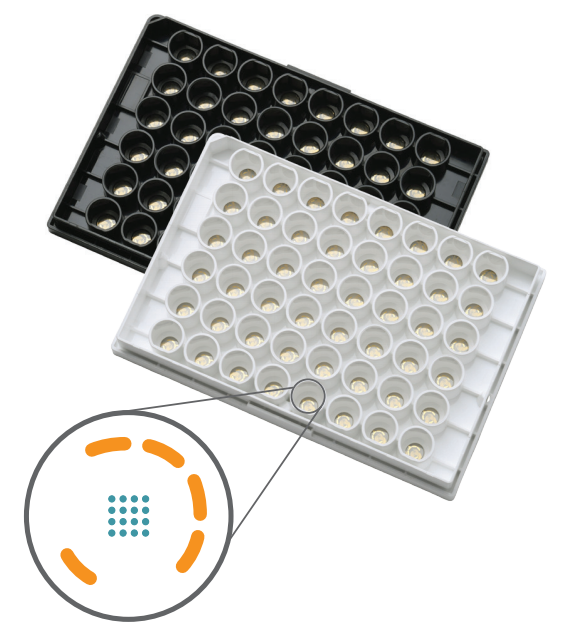
Transparent MEA plates
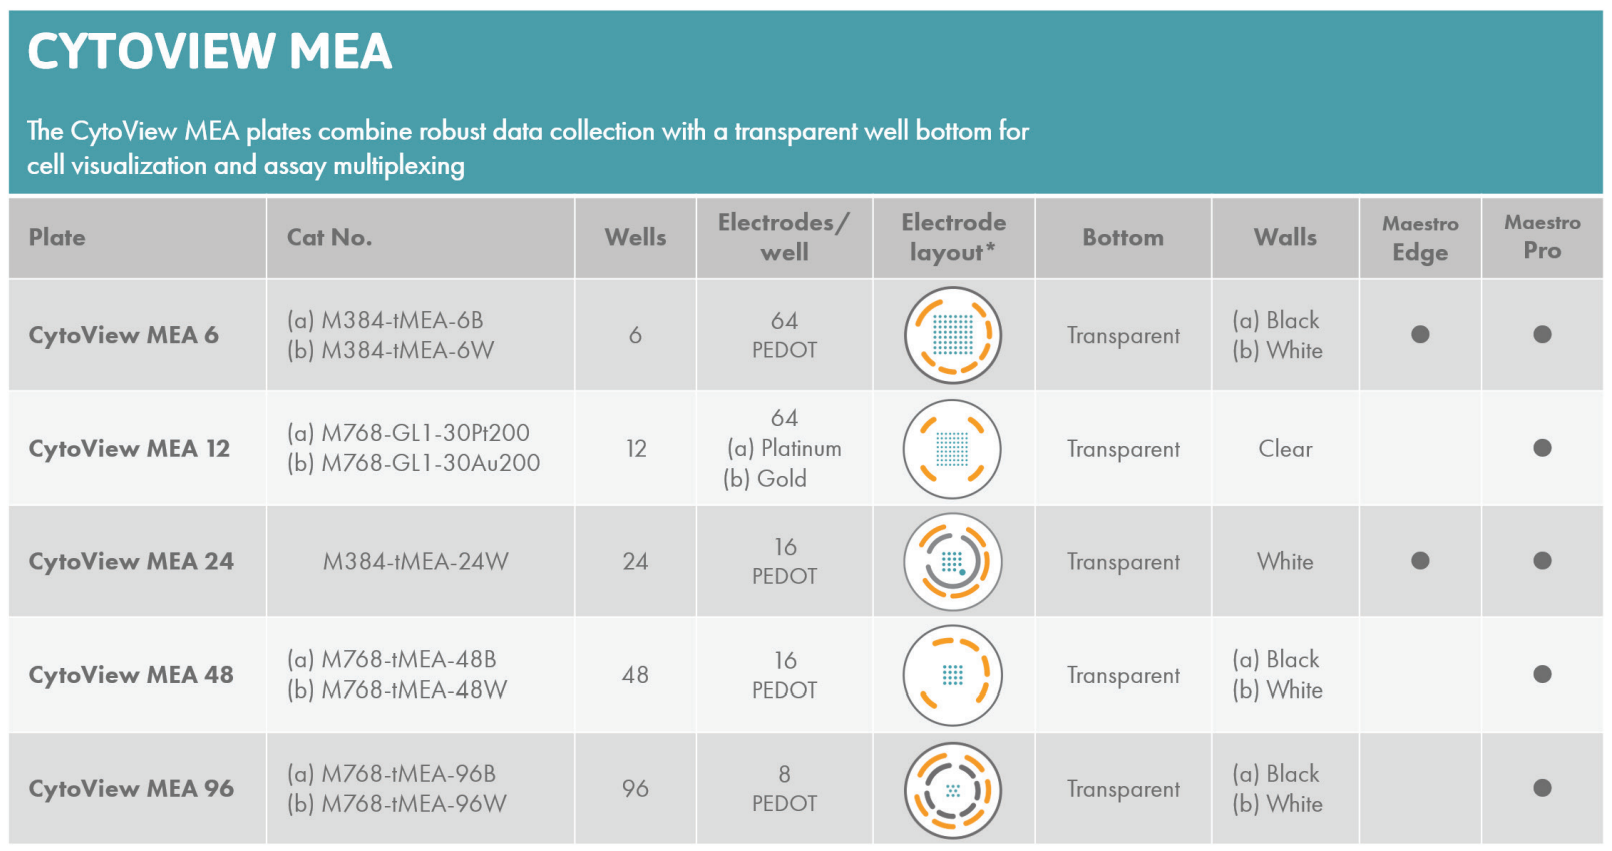
CytoView microelectrode array (MEA) plates for the Maestro Pro, Maestro Edge, and Maestro Apex MEA systems combine unparalleled access to cellular electrical network information with a thin, transparent plate bottom for culture visualization and assay multiplexing. Available in 6-, 24-, 48-, and 96-well formats, CytoView MEA plates contain the industry-leading electrode count per well (up to 64 electrodes per well), deliver low-noise signals, and can be read over days, weeks, or months.
Cell visualization and assay multiplexing
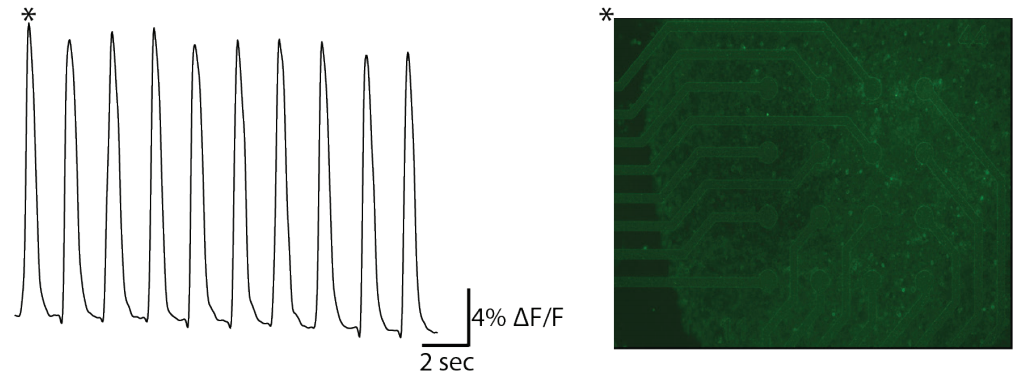
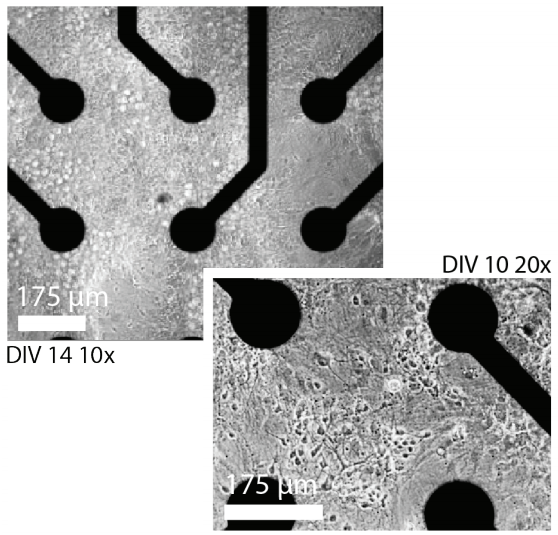
The innovative, transparent plate bottom offers additional assay flexibility including cell visualization and assay multiplexing. Bright field imaging enables confirmation of cell spotting accuracy and correlation of cell culture health and connectivity with MEA results. Multiplex fluorescence- or luminescence-based assays with your MEA study to probe complementary end points.
THE CYTOVIEW ADVANTAGE
-
Industry-leading electrode count for detailed information from every well
-
PEDOT electrode technology ensures collection of the highest quality signals
-
Compatible with light microscopy for daily culture monitoring
-
Multiplex your assay with top- or bottom-read fluorescent and luminescent plate readers
- Choose between black or white walls for optimal application flexibility
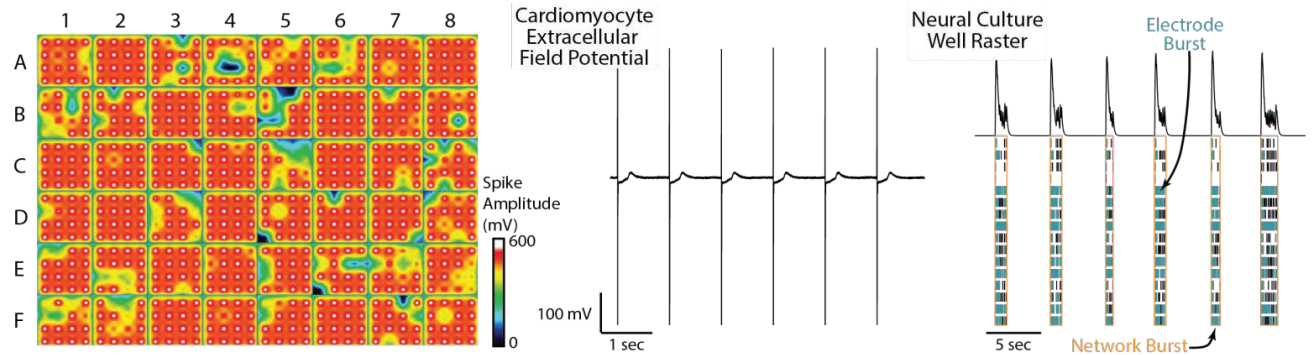
HIGH QUALITY MEA DATA
Both cardiomyocytes and neurons perform well on the CytoView MEA plates, showing excellent coverage across all wells and the high signal-to-noise ratio Axion customers expect.
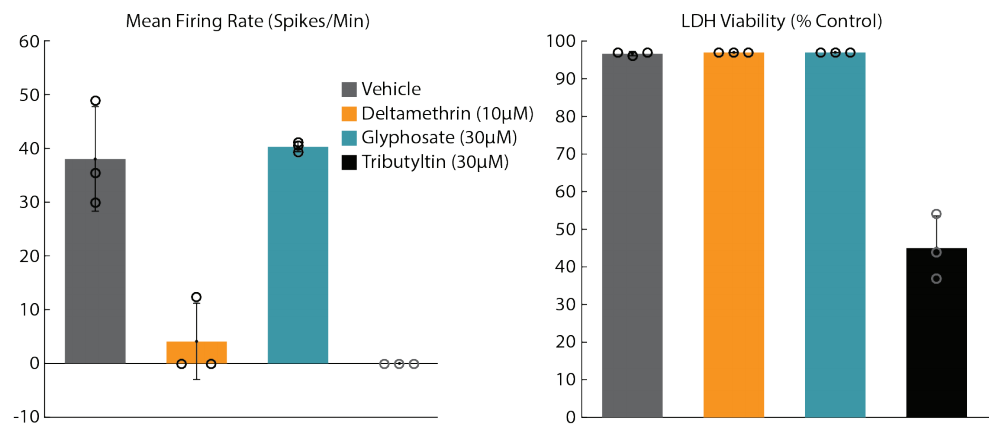
ASSAY MULTIPLEXING ENRICHES MEA DATA
With the transparent CytoView plates, reporter-based (ex. fluorescent or luminescent) assays can now be used to complement MEA data generated from the same well. The combination of electrophysiological data with report-based assays can provide supplementary information regarding compound mechanism of action.