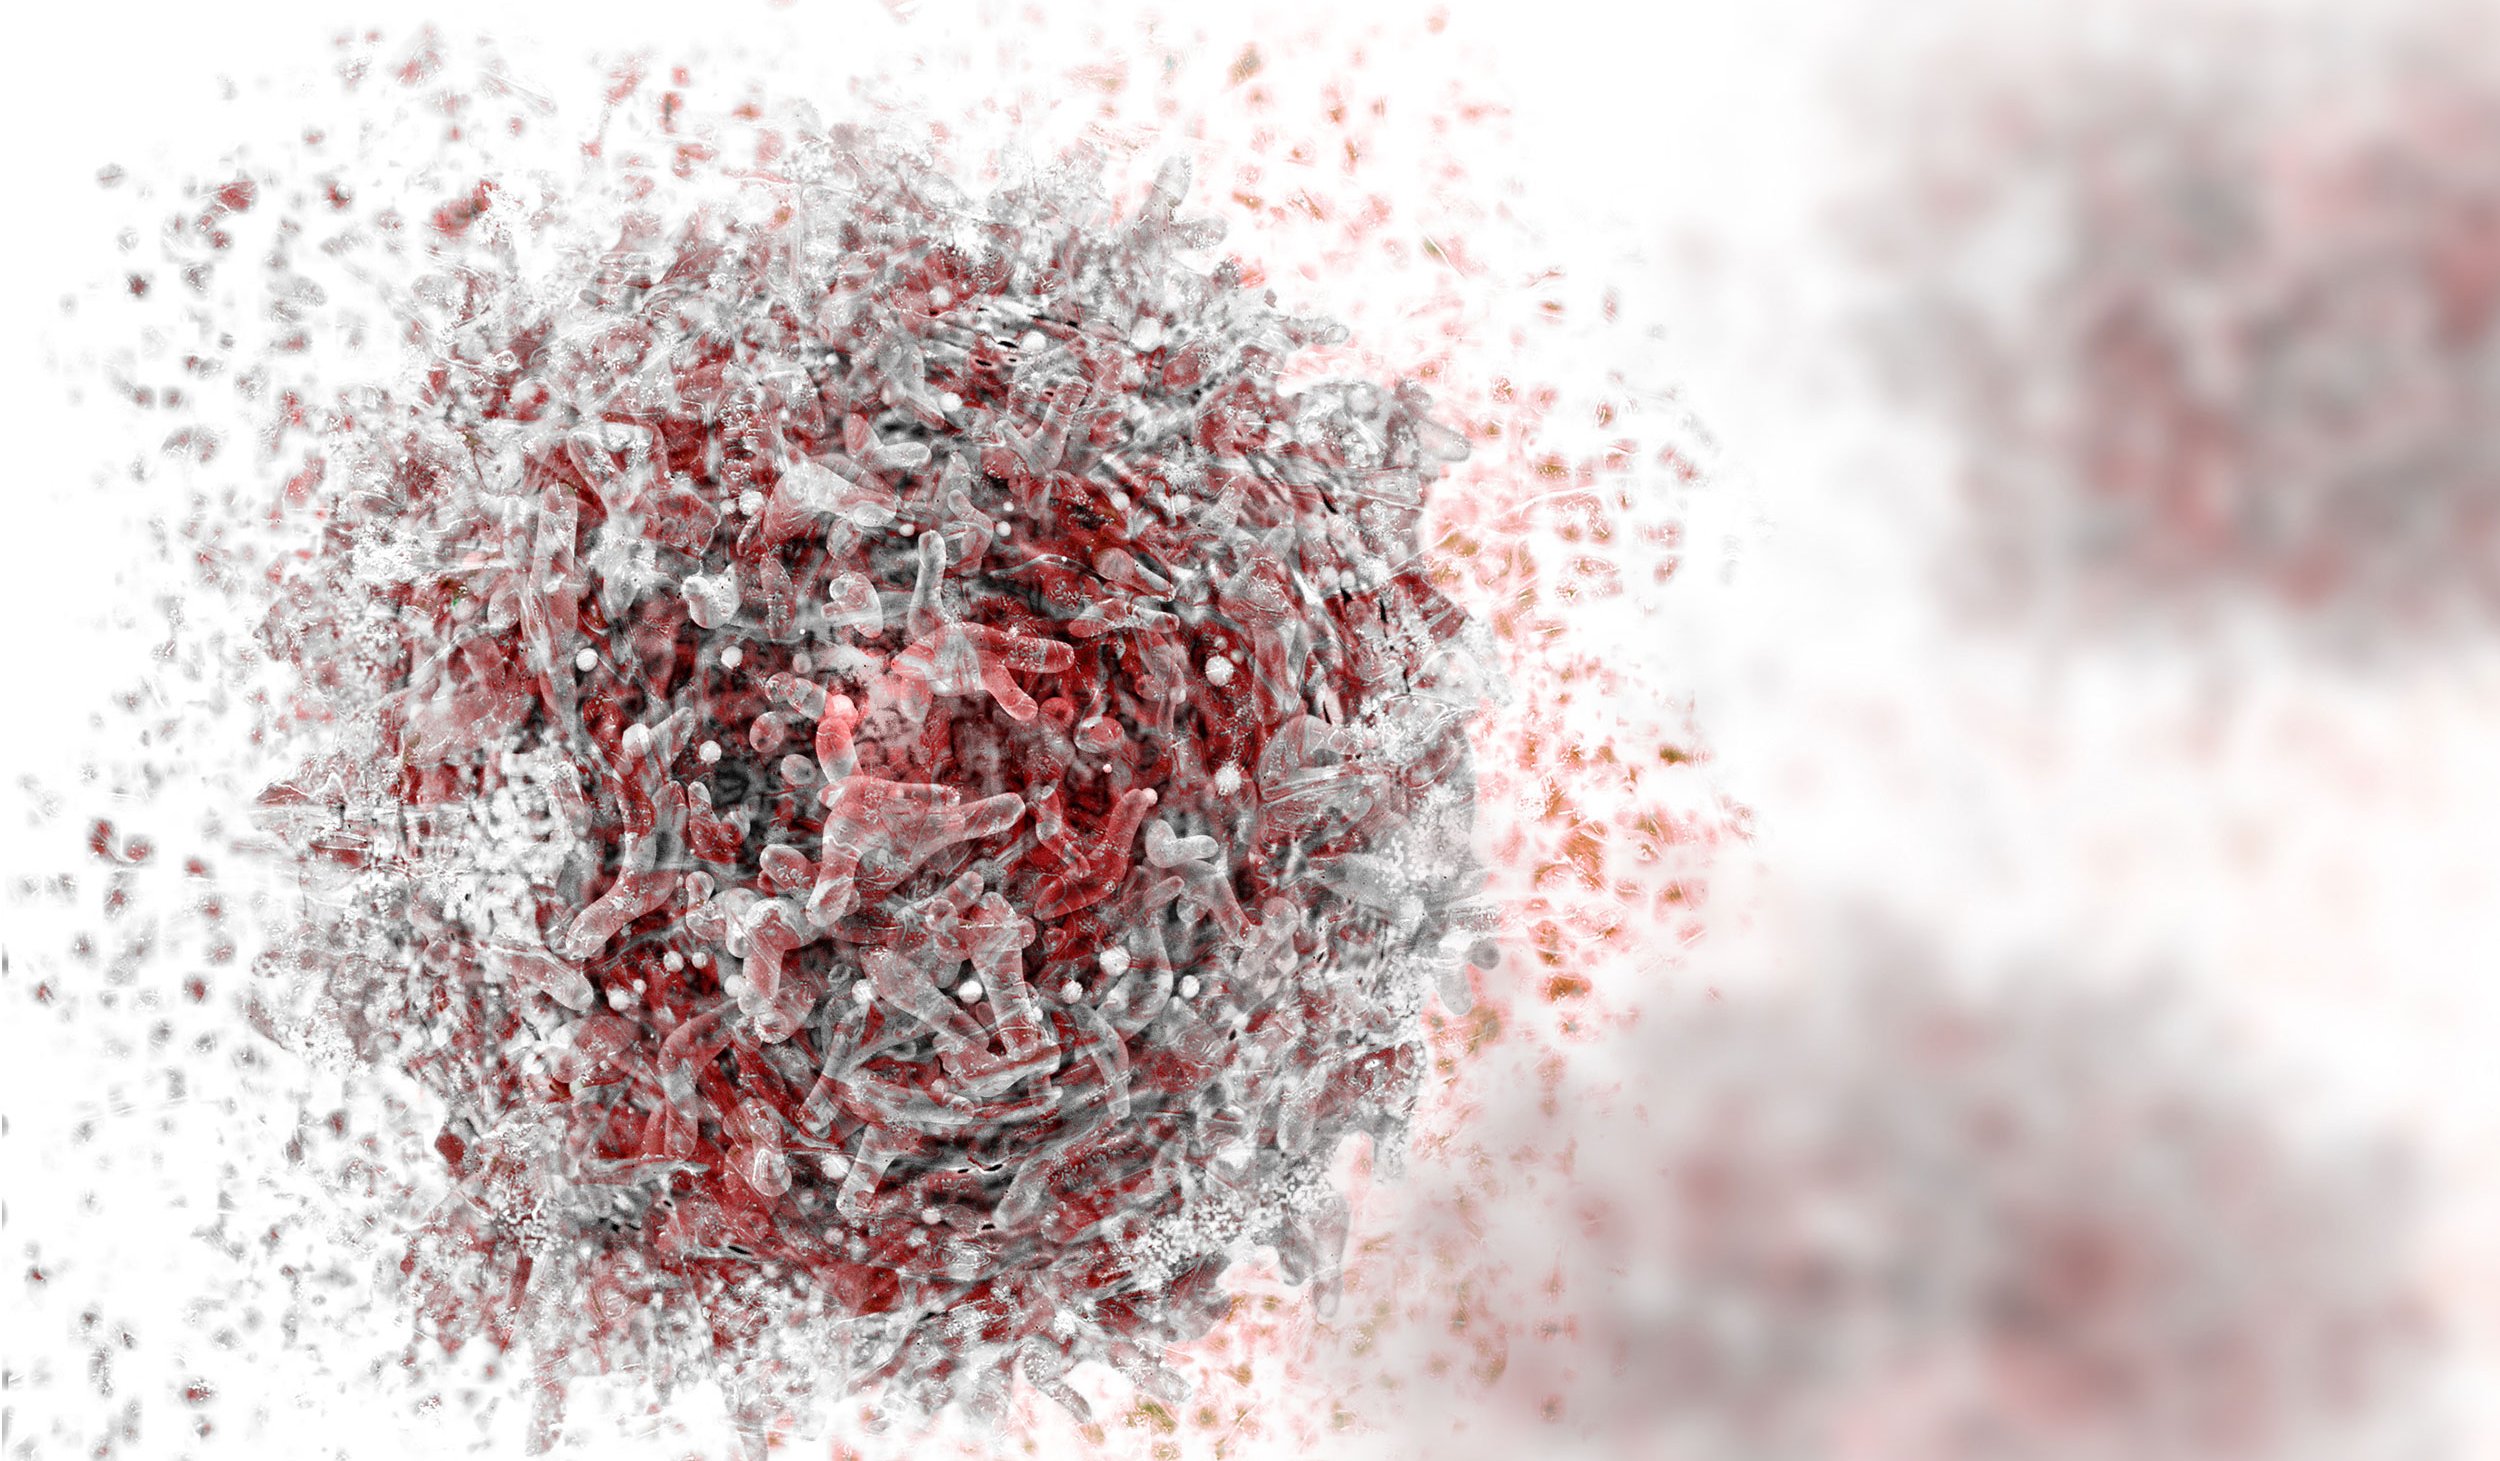
Cytotoxicity is the quality of being toxic to a cell. Assessing the effect of novel drugs or therapies on in vitro cell viability and health is critical to ensure a treatment is safe and effective. There are many types of cytotoxicity and viability assays available for primary, stem cell-derived, cancer, bacterial, or virus-infected cell culture. When deciding on an assay, some things to consider are:
- >> Are my dyes or reagents toxic? Do they interfere with the biology I wish to study?
- >> How do I know which timepoints to take?
- >> How complex is the assay and how much hands-on time will it require?
- >> How much are the reagents, plates, and cells?
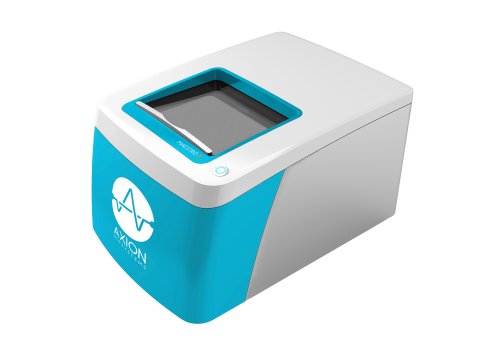
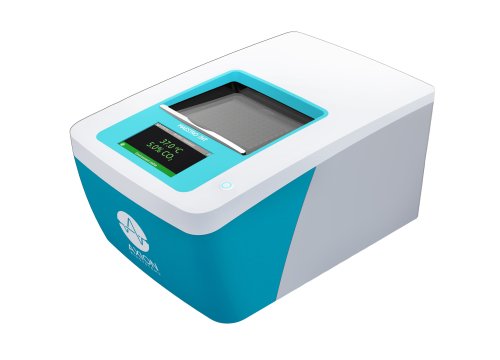
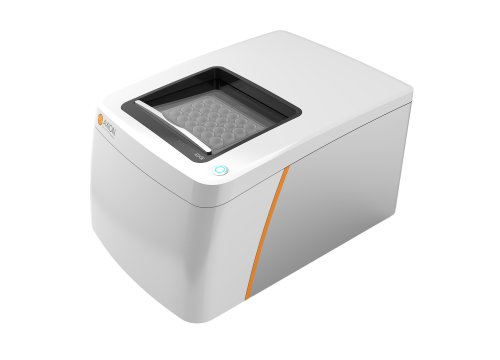
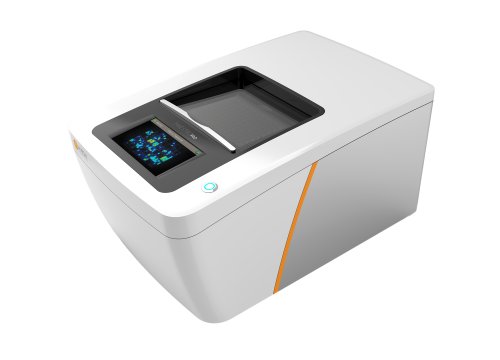
The Maestro impedance assay offers a simple solution to those questions. No dyes or complex handling. One plate reveals the full cellular response in one simple assay.
In vitro real time, label free cytotoxicity assays
-
Dose response curves: get the best fit for your data>
-
Quickly calculate cytolysis and kill time50%>
-
Reliable and robust, Maestro cell viability assays correlate with traditional endpoint assays>
-
Capture the full time-course of in vitro cytotoxicity and cell viability with a simple live-cell assay>
The cytotoxicity of a treatment depends on the delivered dose. Easily see your result with the Maestro Z platform in real-time and easily generate dose-response curves at multiple timepoints from one simple assay.
The cytotoxicity of a treatment depends on the delivered dose. With increasing concentration of Dox, the real-time resistance (left) and cytolysis (middle) curves show increased cytotoxicity. The cytolysis was evaluated as a function of the concentration (right) and fit according to the Hill equation. The analysis estimates the 50% effective concentration (EC50) of Dox to be 0.43 micromolar at 72 hours post-dose.
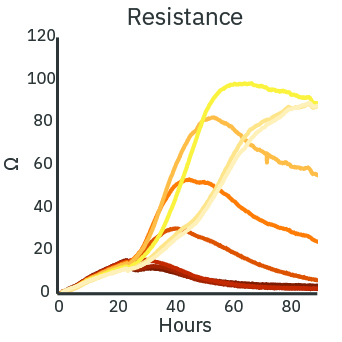
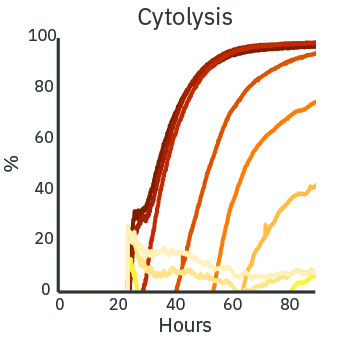
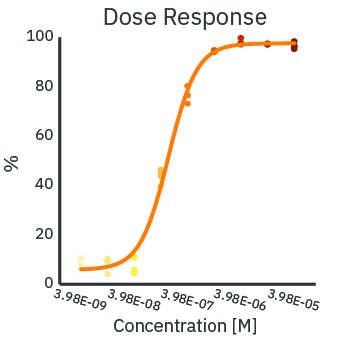
(Left) SKOV3 cancer cells were cultured at 5k cells per well in a CytoView Z 96-well plate. After 24 hours of culture, the SKOV3 cells were dosed with Dox at 9 concentrations in half-log increments from 0.01 to 100 micromolar. The highest concentrations of Dox produced the lowest measured resistance over time. (Middle) The Dox treated wells were compared with the “No Treatment Control” condition to compute cytolysis. The cytolysis was higher for increasing concentrations of Dox. (Right) The Hill equation was fit to the cytolysis data at 72 hours post-dose. The EC50 in this assay was 0.43 micromolar according to the dose response analysis.
While the degree of cell death is important and often measured by endpoint assays, the kinetics of cell death are vital for understanding mechanisms and quantifying efficacy. The Maestro Z impedance platform real-time and label-free data measurements allow for dynamic toxicity analysis.
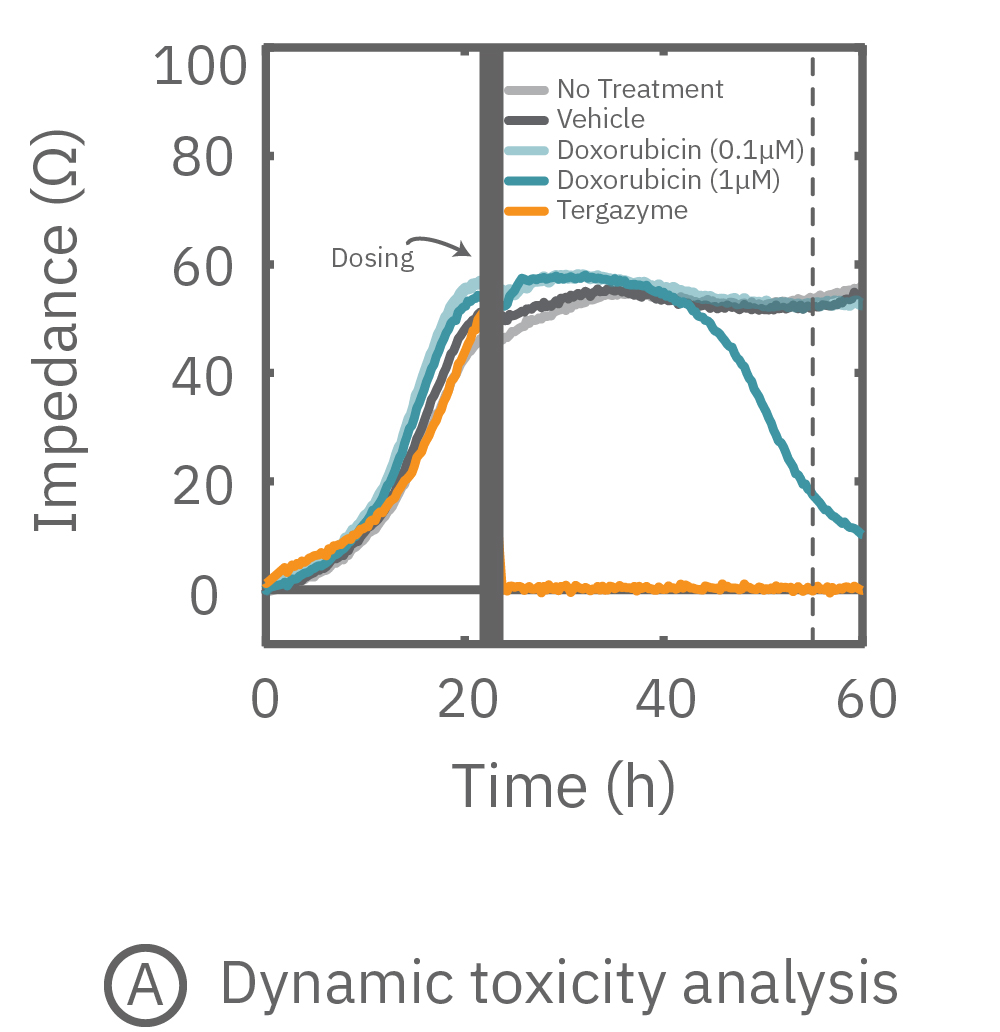
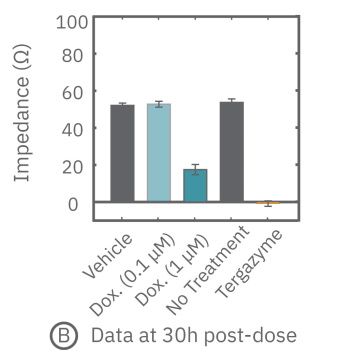
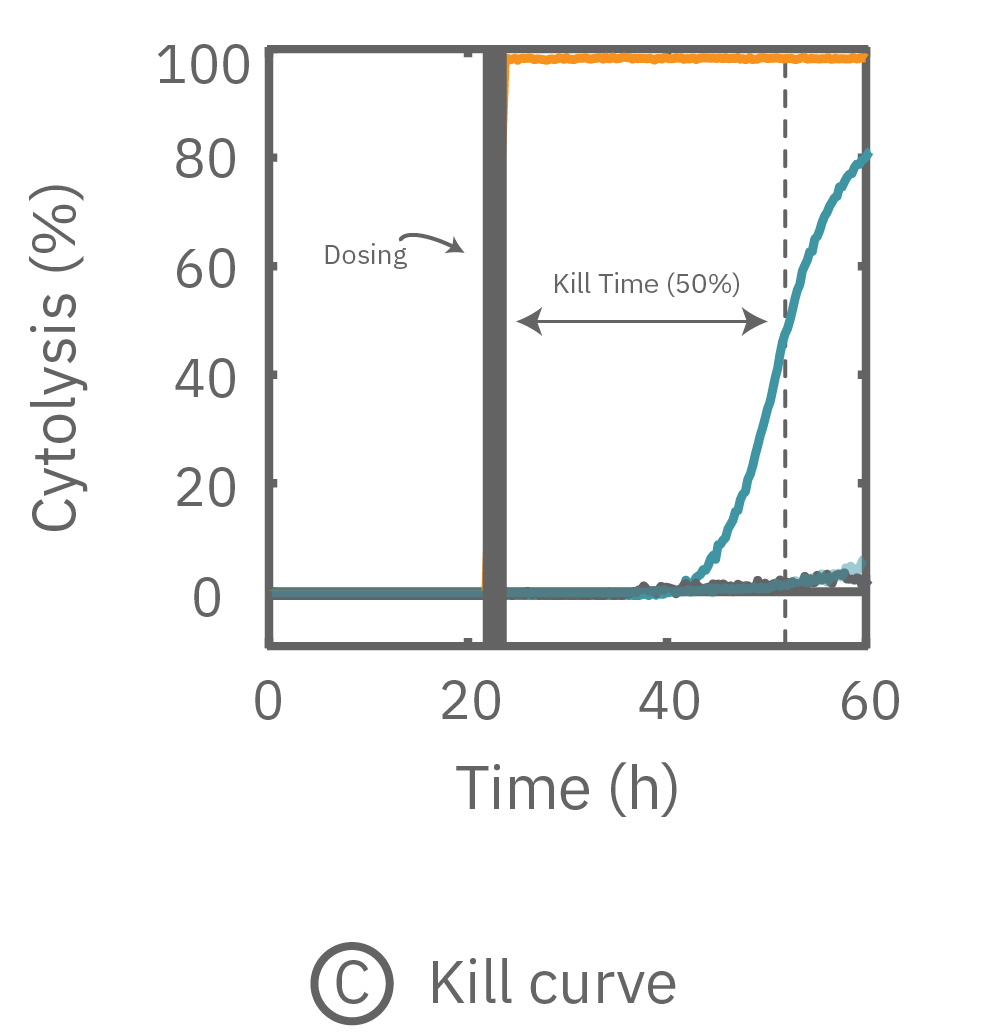
(A) 24 hours after plating, Dox is applied and recorded for an additional 36 hours. (B) Dox effect at 30 hours post-dose. (C) Using on-plate controls for cell growth (No Treatment) and death (Tergazyme), the percent cytolysis was tracked in real time throughout the experiment and kill time50 was calculated.
The figures above highlight the dynamic cytotoxic response over time. The percentage of cytolysis, or cell death, can be tracked in real time, and the time to 50% cell death (kill time50) provides insight into the kinetics and efficacy of a treatment's cytotoxicity.
All products and application data are for research use only and not intended for human diagnostic or therapeutic uses.
In vitro cell viability assays on the Maestro Z, however, are not limited to a single time point.
The number of cells directly scales with impedance. The correlation is so robust it can meet ISO 20391-2 standards for reproducibility. When compared to a traditional viability endpoint, like an MTT assay, the results directly correlate. In vitro cell viability assays on the Maestro Z, however, are not limited to a single time point.
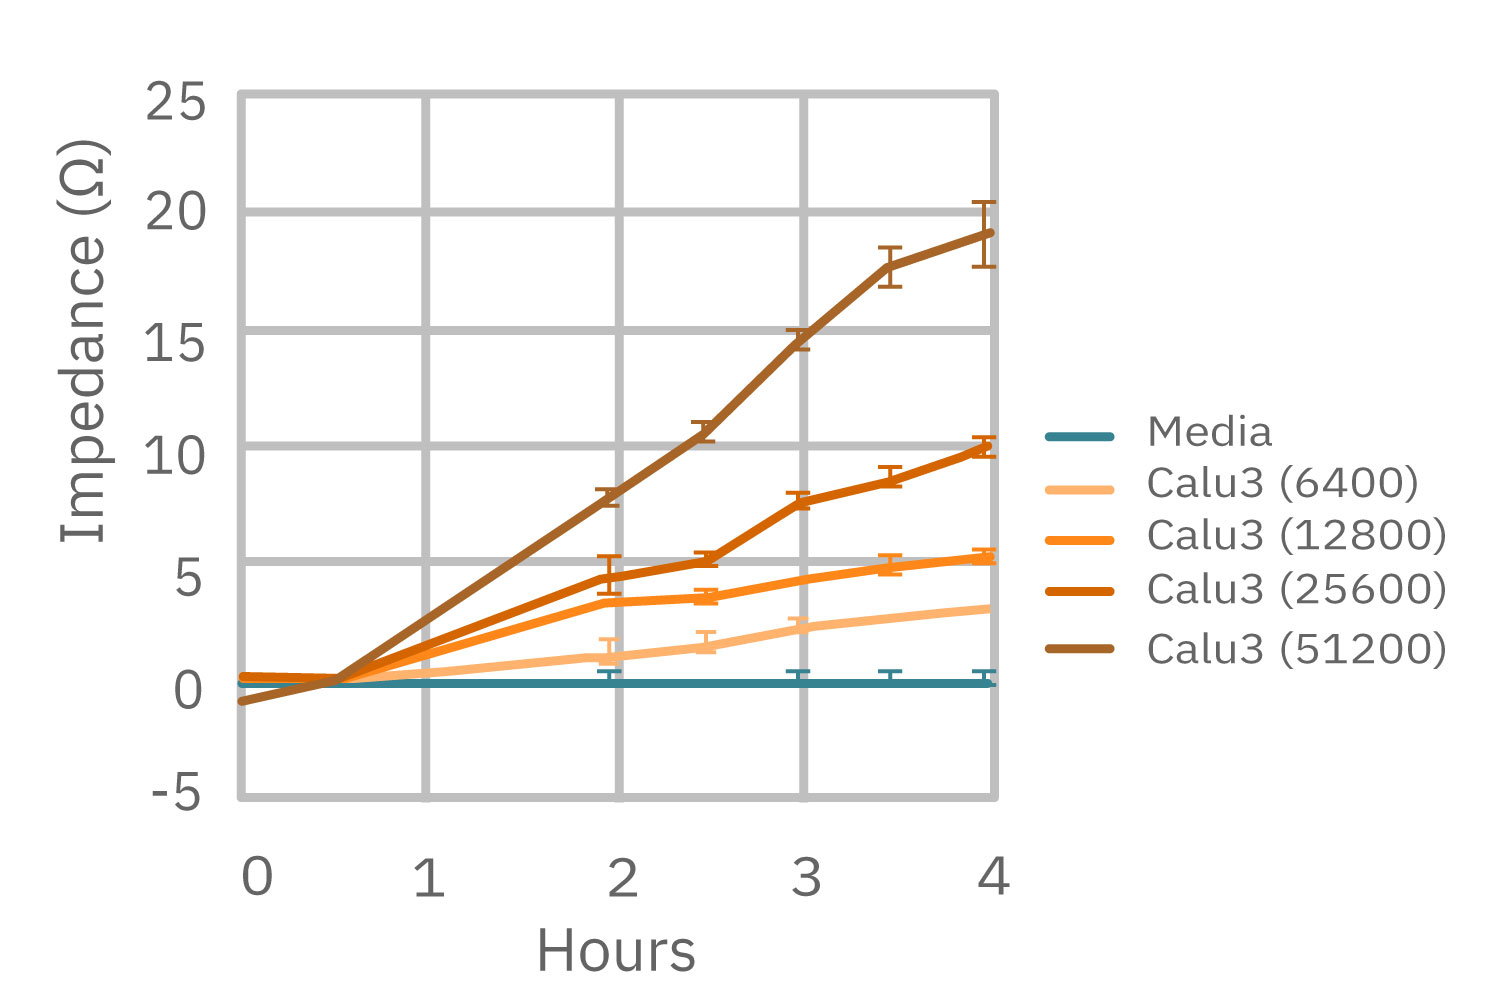
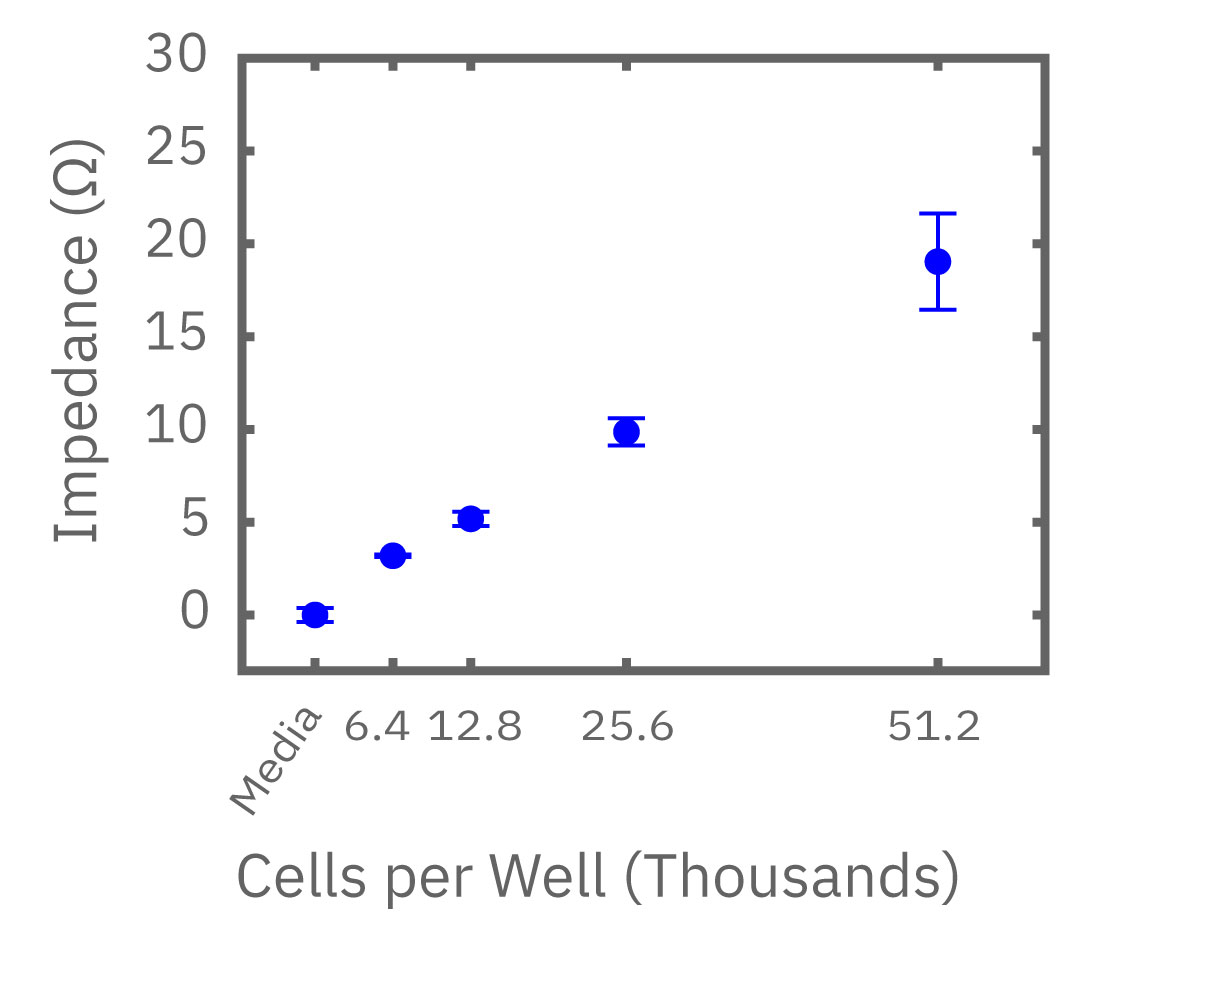
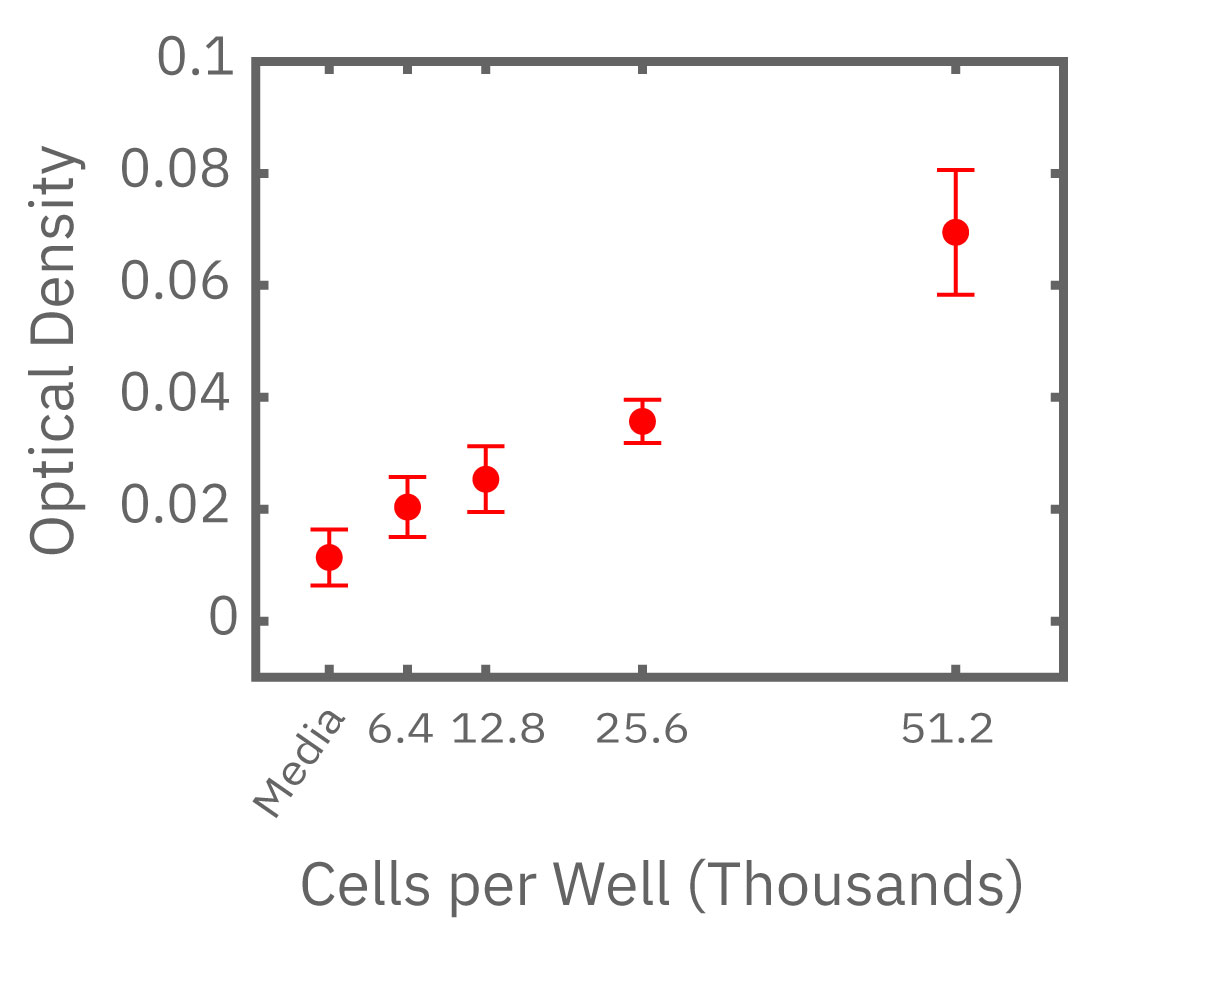
(Left) Calu-3 cells plated from 6400-51200 cells/well as measured by the Maestro Z. (Middle) 4 hours after plating impedance measurements show a linear relationship that directly correlates with (Right) optical MTT assay results.
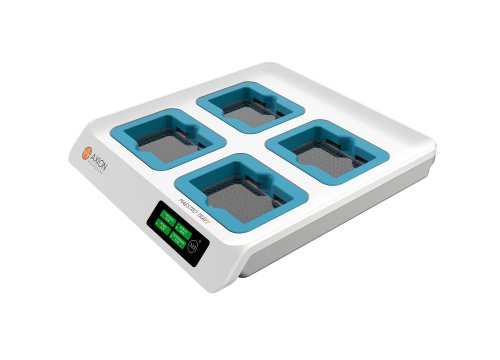
Dose response analysis is well-suited for high-throughput screening assays. A wide range of treatments, with full dose response ranges, can be evaluated simultaneously with the Maestro TrayZ 4 -plate impedance platform.
In this case study, SKOV3 cells were plated in four different 96-well CytoView-Z plates. At 24 hours post cell seeding, drugs (compound 1 and compound 2) were added in a six-point concentration sweep with full-log intervals.
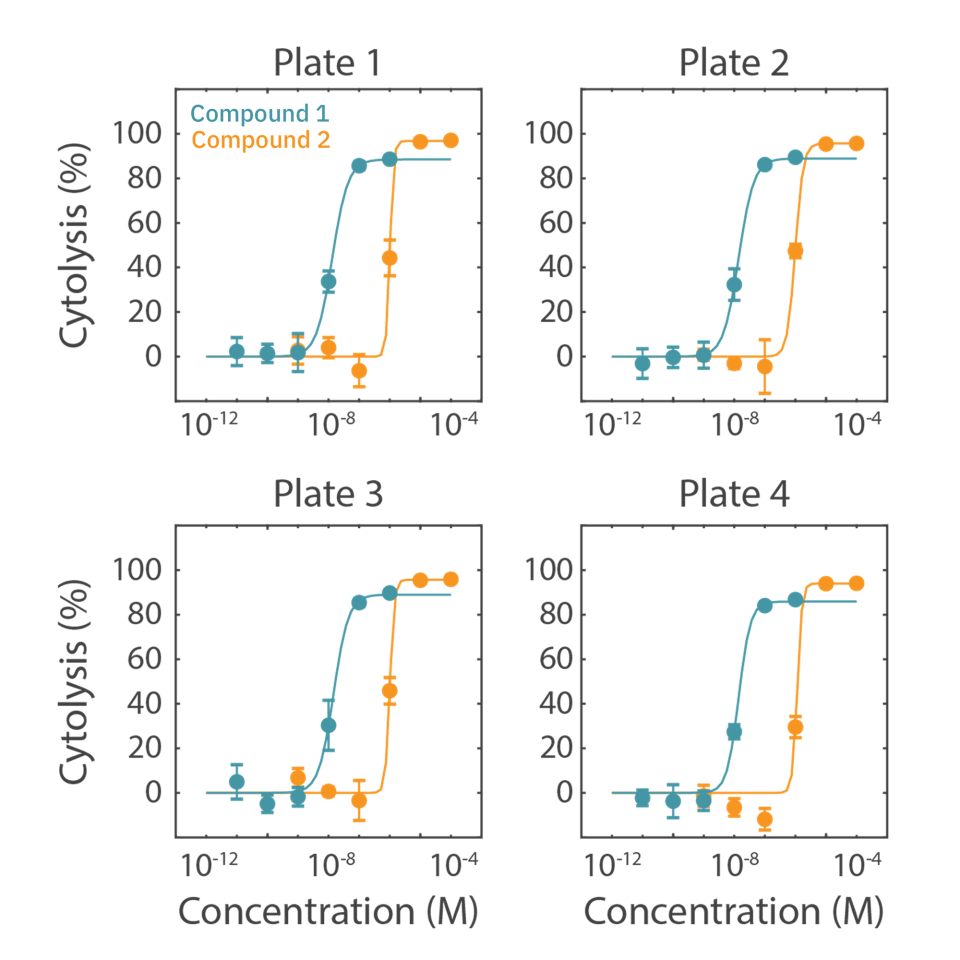
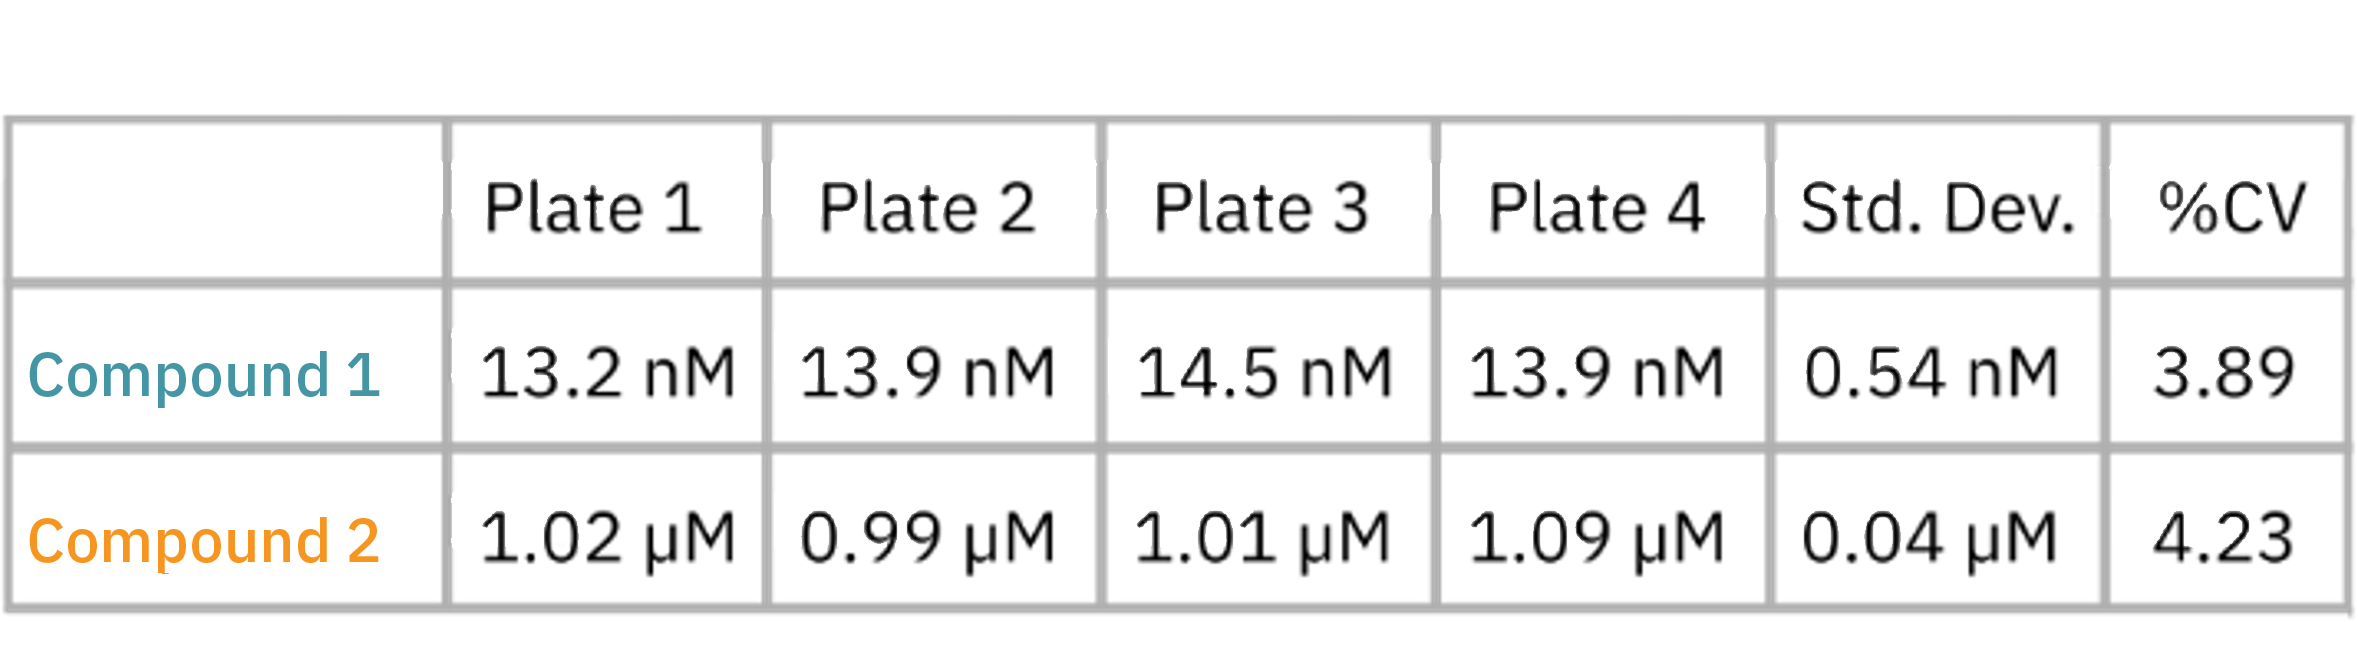
Cytolysis was computed relative to a “No Treatment Control” group and a “Full Lysis Control” group (data not shown) and the dose response analysis was performed for each compound. As illustrated by the data in the figure and as shown in table, the EC50 for each drug was calculated for each plate. The EC50 values are similar between plate replications and show minimal plate-to-plate variability as indicated as the overall % CV values.
This example highlights the assay reliability and robustness using the Maestro Z family systems for dose response assays and high throughput screening.