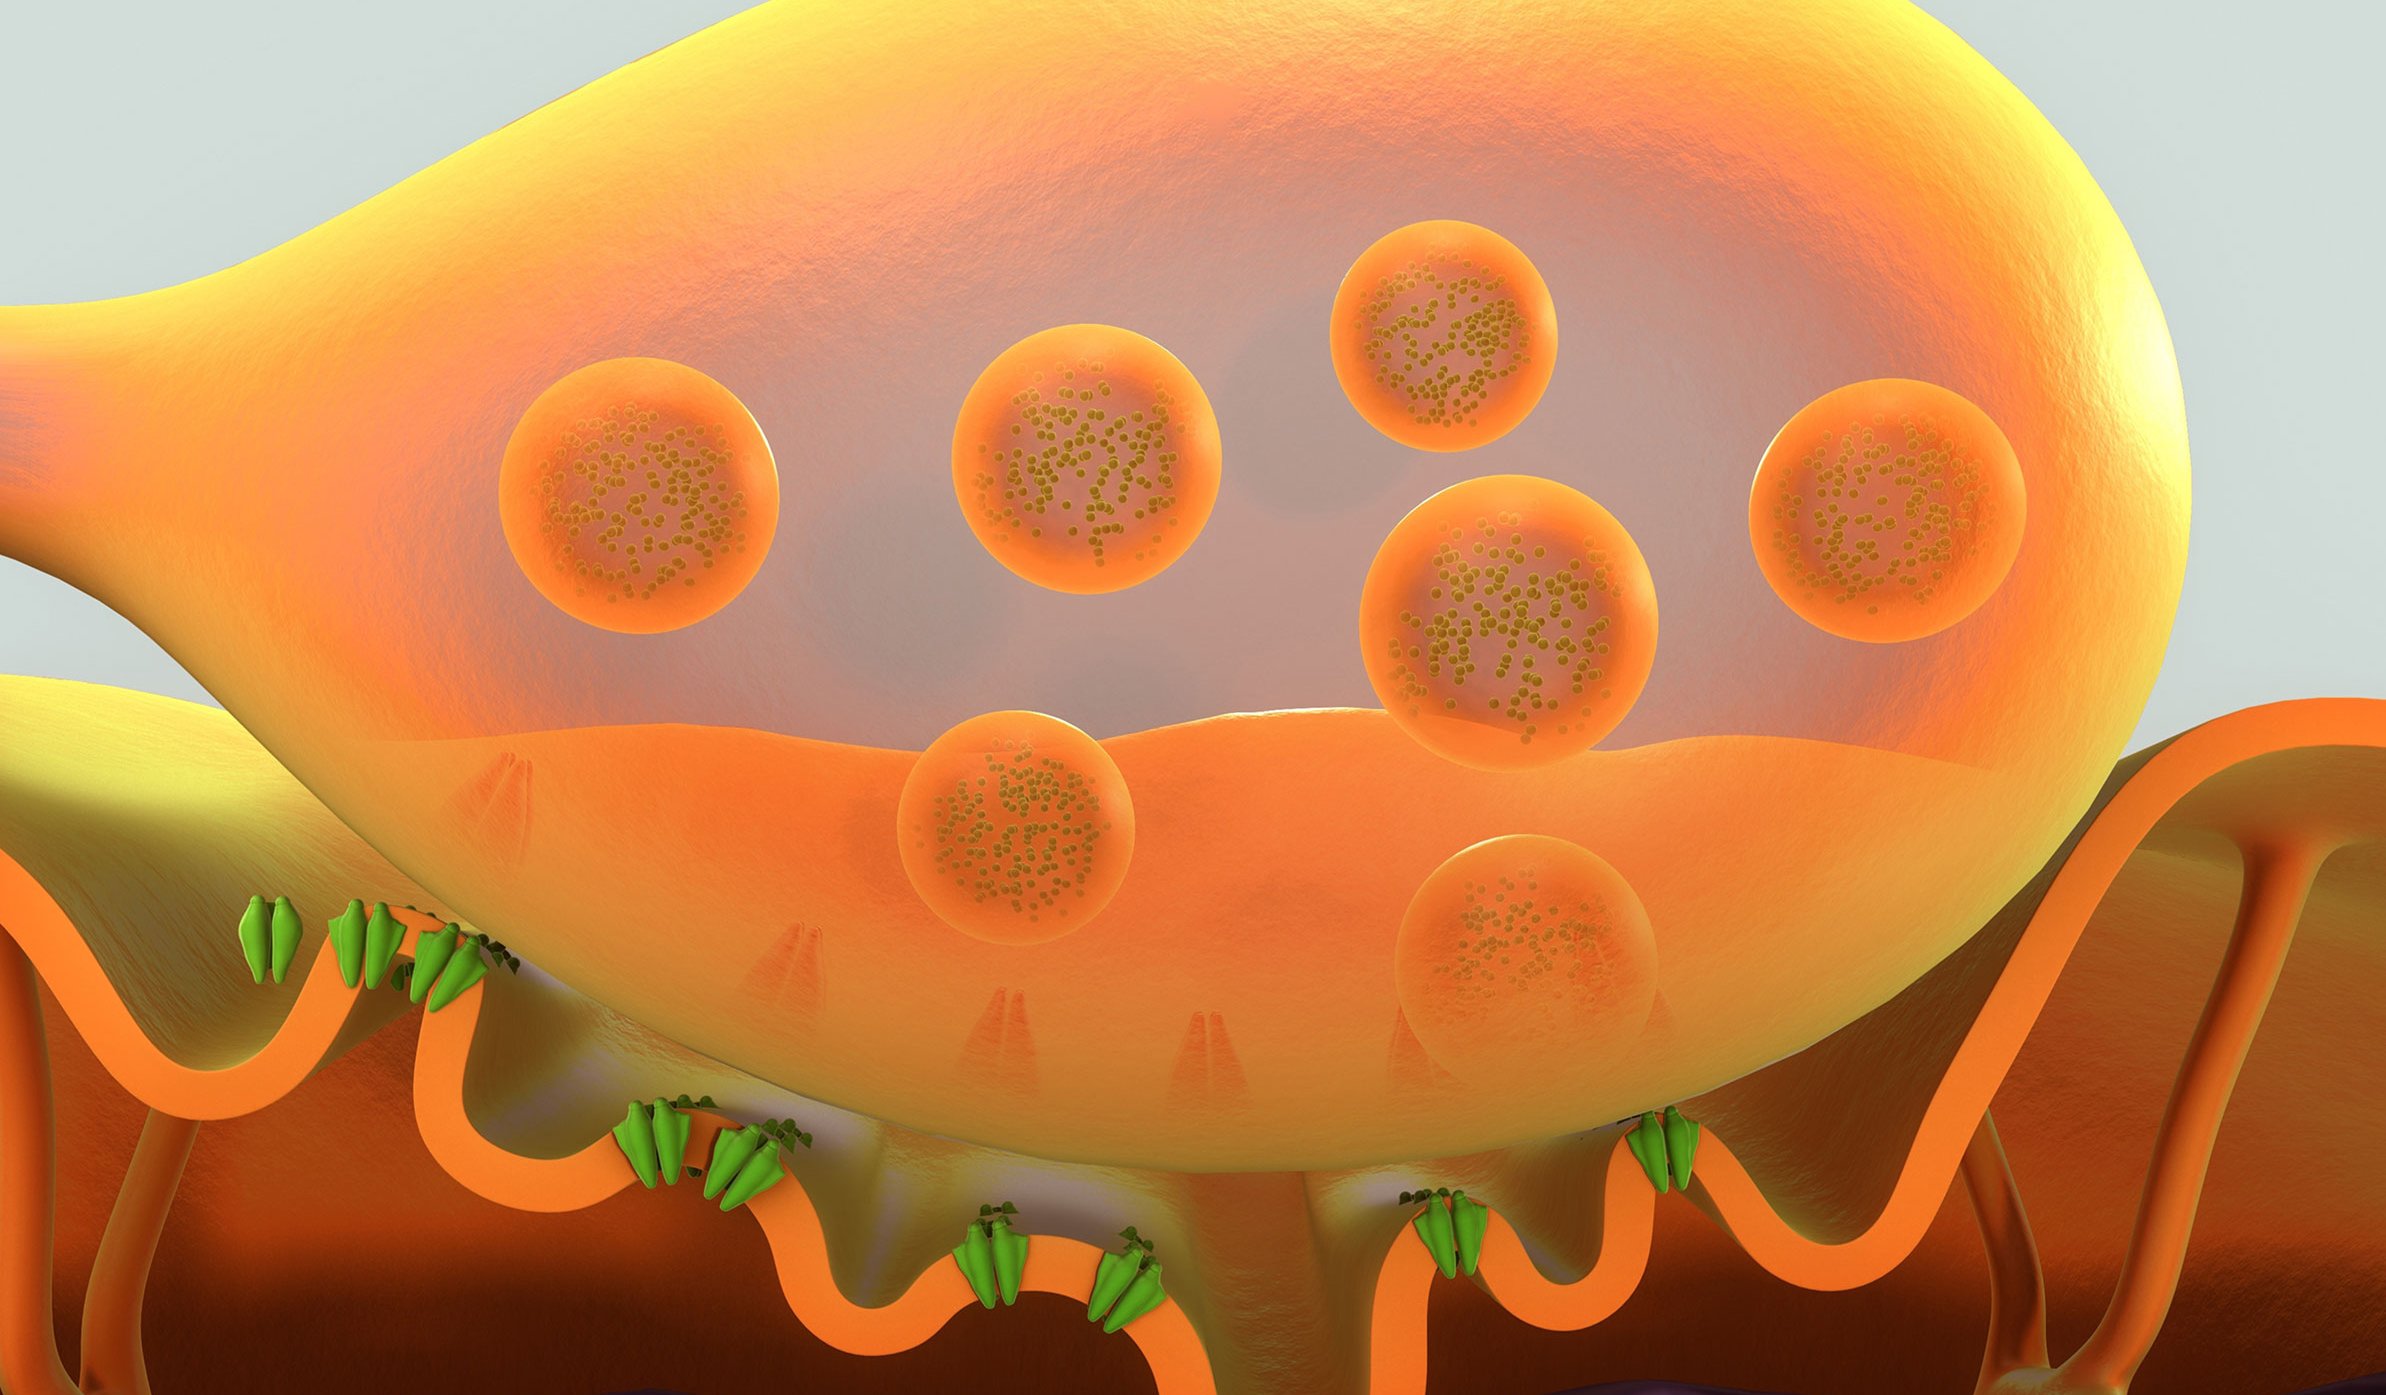
Neuromuscular junctions are specialized synapses between a motor neuron and a muscle fiber. Motor neurons transmit signals to muscle fibers and initiate muscle contraction through the release of acetylcholine (ACh). The pathophysiology of neuromuscular disorders can be diverse. Physiological function of the junction may be interrupted by an autoimmune response, such as the case with myasthenia gravis, or through toxins like botulinum toxin or many insecticides.
The Maestro Pro and Edge MEA systems have the ability to measure from both neurons and skeletal muscle simultaneously. Combined with the selective optical stimulation capabilities of the Lumos, an easy-to-use, scalable model of neuromuscular junction function can be achieved.
-
Controlling neuromuscular junction-mediated contractions with light>
-
Formation of Functional Spinal Cord Networks with CPG-like Activity in NMOs>
-
Assay Steps>
The failure of the neuromuscular junction (NMJ) is a key component of degenerative neuromuscular disease, yet how NMJs degenerate in disease is unclear. With the ability to create relevant cell types from any genetic background, human induced pluripotent stem cells (hiPSCs) are a useful tool for disease modeling. Here Swartz et al. present a scalable, hiPSC-derived co-culture system composed of independently derived spinal motor neurons (MNs) and skeletal myotubes (sKMs). In a model of C9orf72-associated disease, co-cultures form functional NMJs that can be manipulated through optical stimulation. Channel rhodopsin expressing motor neurons were able to elicit muscle contractions in the co-cultured sKMs when illuminated with blue light using the Lumos. Utilization of this co-culture model as a tunable, patient-derived system may offer significant insights into NMJ formation, maturation, repair, or pathogenic mechanisms that underlie NMJ dysfunction in disease.
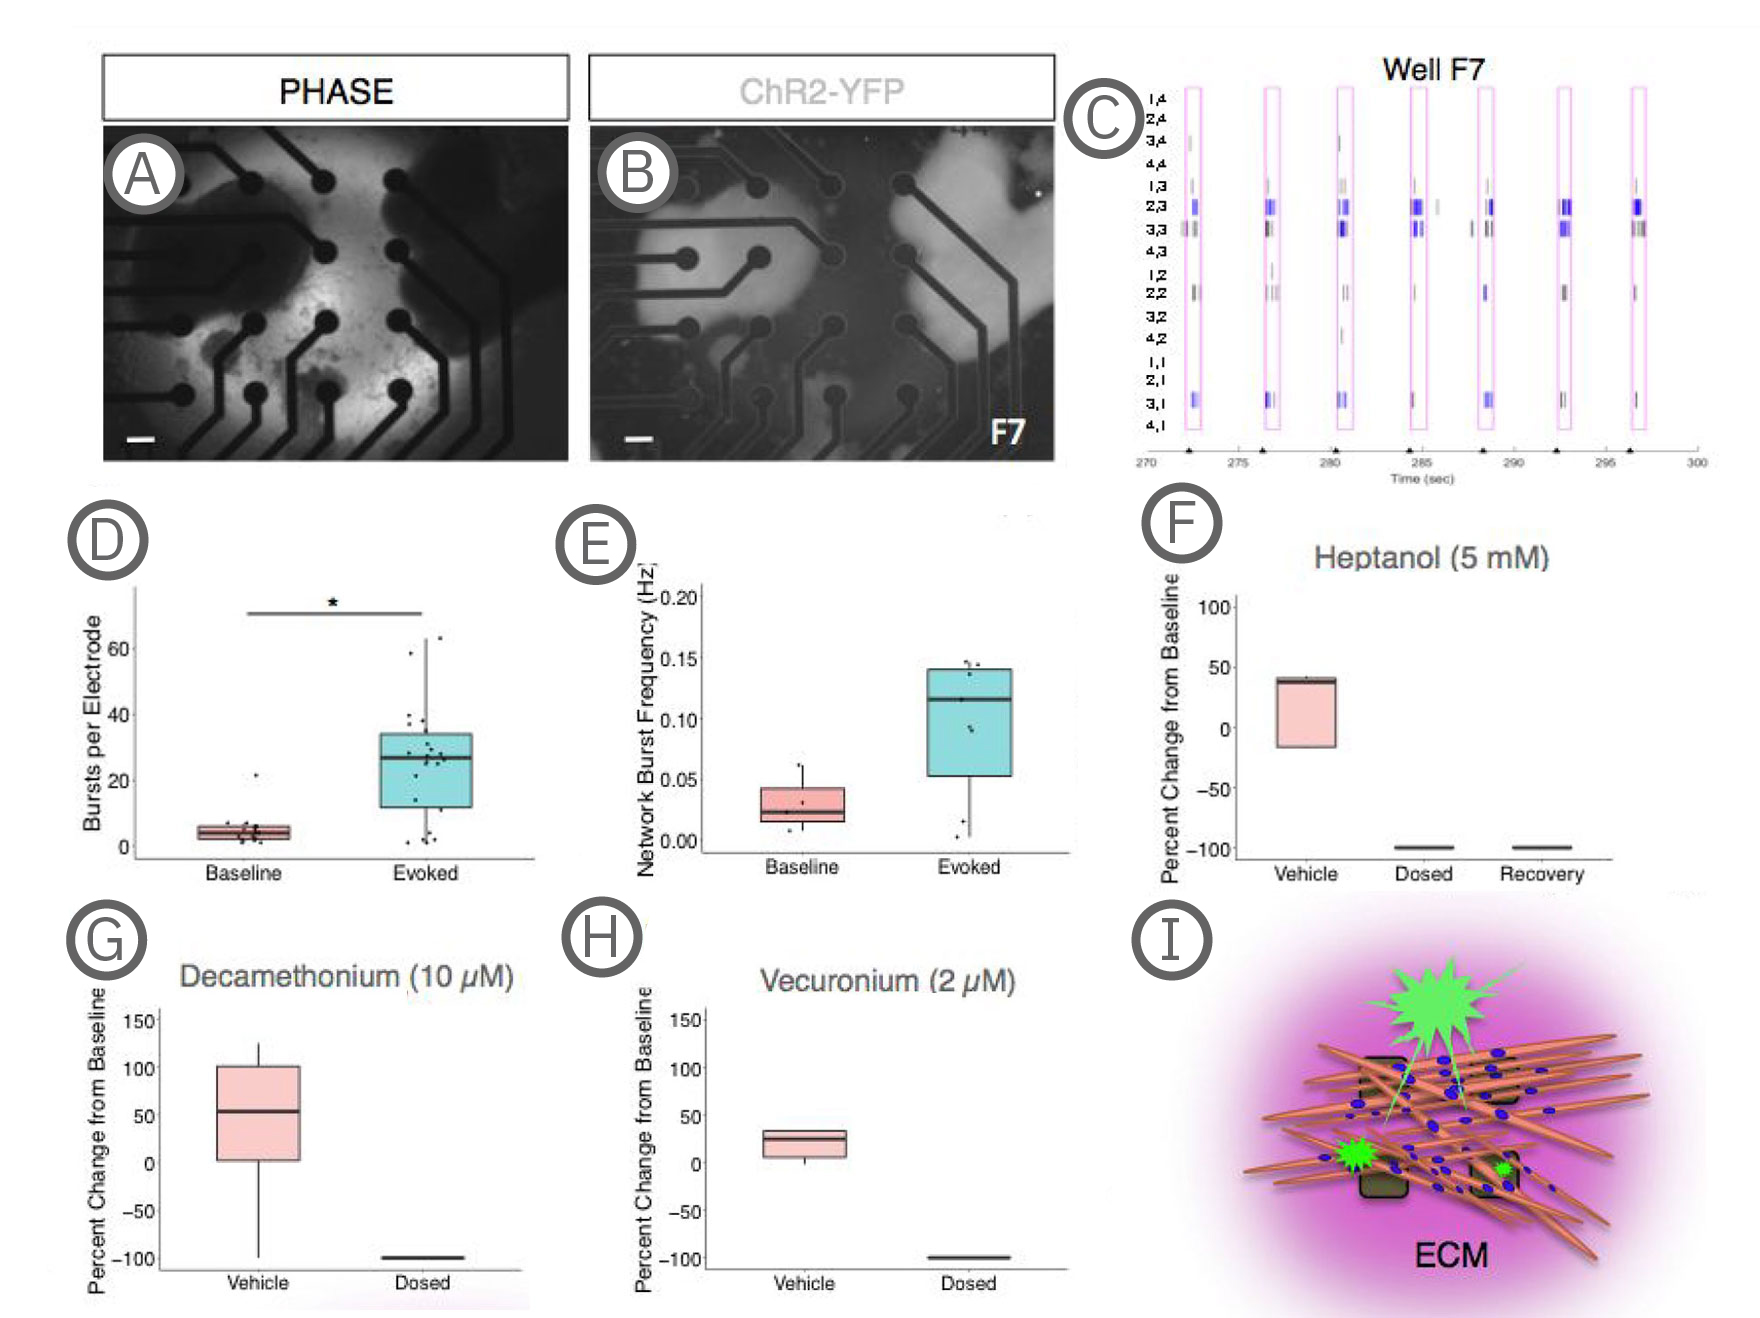
(A-B) Co-culture on a 4x4 array of electrodes. (C) Raster plot of the well shown in A-B during paced stimulation. Tick marks on the x-axis indicate light stimulation. Pink boxes represent evoked spike timeframe with bursts in blue. Electrode coordinates are labeled on the y-axis. (D) Quantification of electrode activity and network activity (E) during baseline and stimulated recordings. Dots represent individual wells. **, p < .01; ***, p < .001. (F) Decreased evoked spike counts following treatment with the gap junction blocker, heptanol treatment, which could be partially recovered with decreased concentration or washout (recovery). (G-H) Evoked spike counts were abolished with neuromuscular antagonists, decamethonium bromide and vecuronium. Data represented as the percent change per active electrode at baseline (untreated). (I) Model depicting co-cultures on MEAs. sKMs are plated on top of protein substrate and exist in an extracellular protein matrix [Swartz et al. (2020), Establishment of a Human Induced Pluripotent Stem Cell-Derived Neuromuscular Co-Culture Under Optogenetic Control. bioRxiv].
Neuromuscular networks assemble during early human embryonic development and are essential for the control of body movement. Previous neuromuscular junction modeling efforts relied on the generation of either spinal cord neurons or skeletal muscles from hPSCs and their co-culture. Here, Martins et al. used hPSC-derived axial stem cells, the building blocks of the posterior body, to simultaneously generate spinal cord neurons and skeletal muscle cells that self-organize to generate human neuromuscular organoids (NMOs). NMOs contain functional neuromuscular junctions supported by terminal Schwann cells, contract and can be maintained in culture for several months.
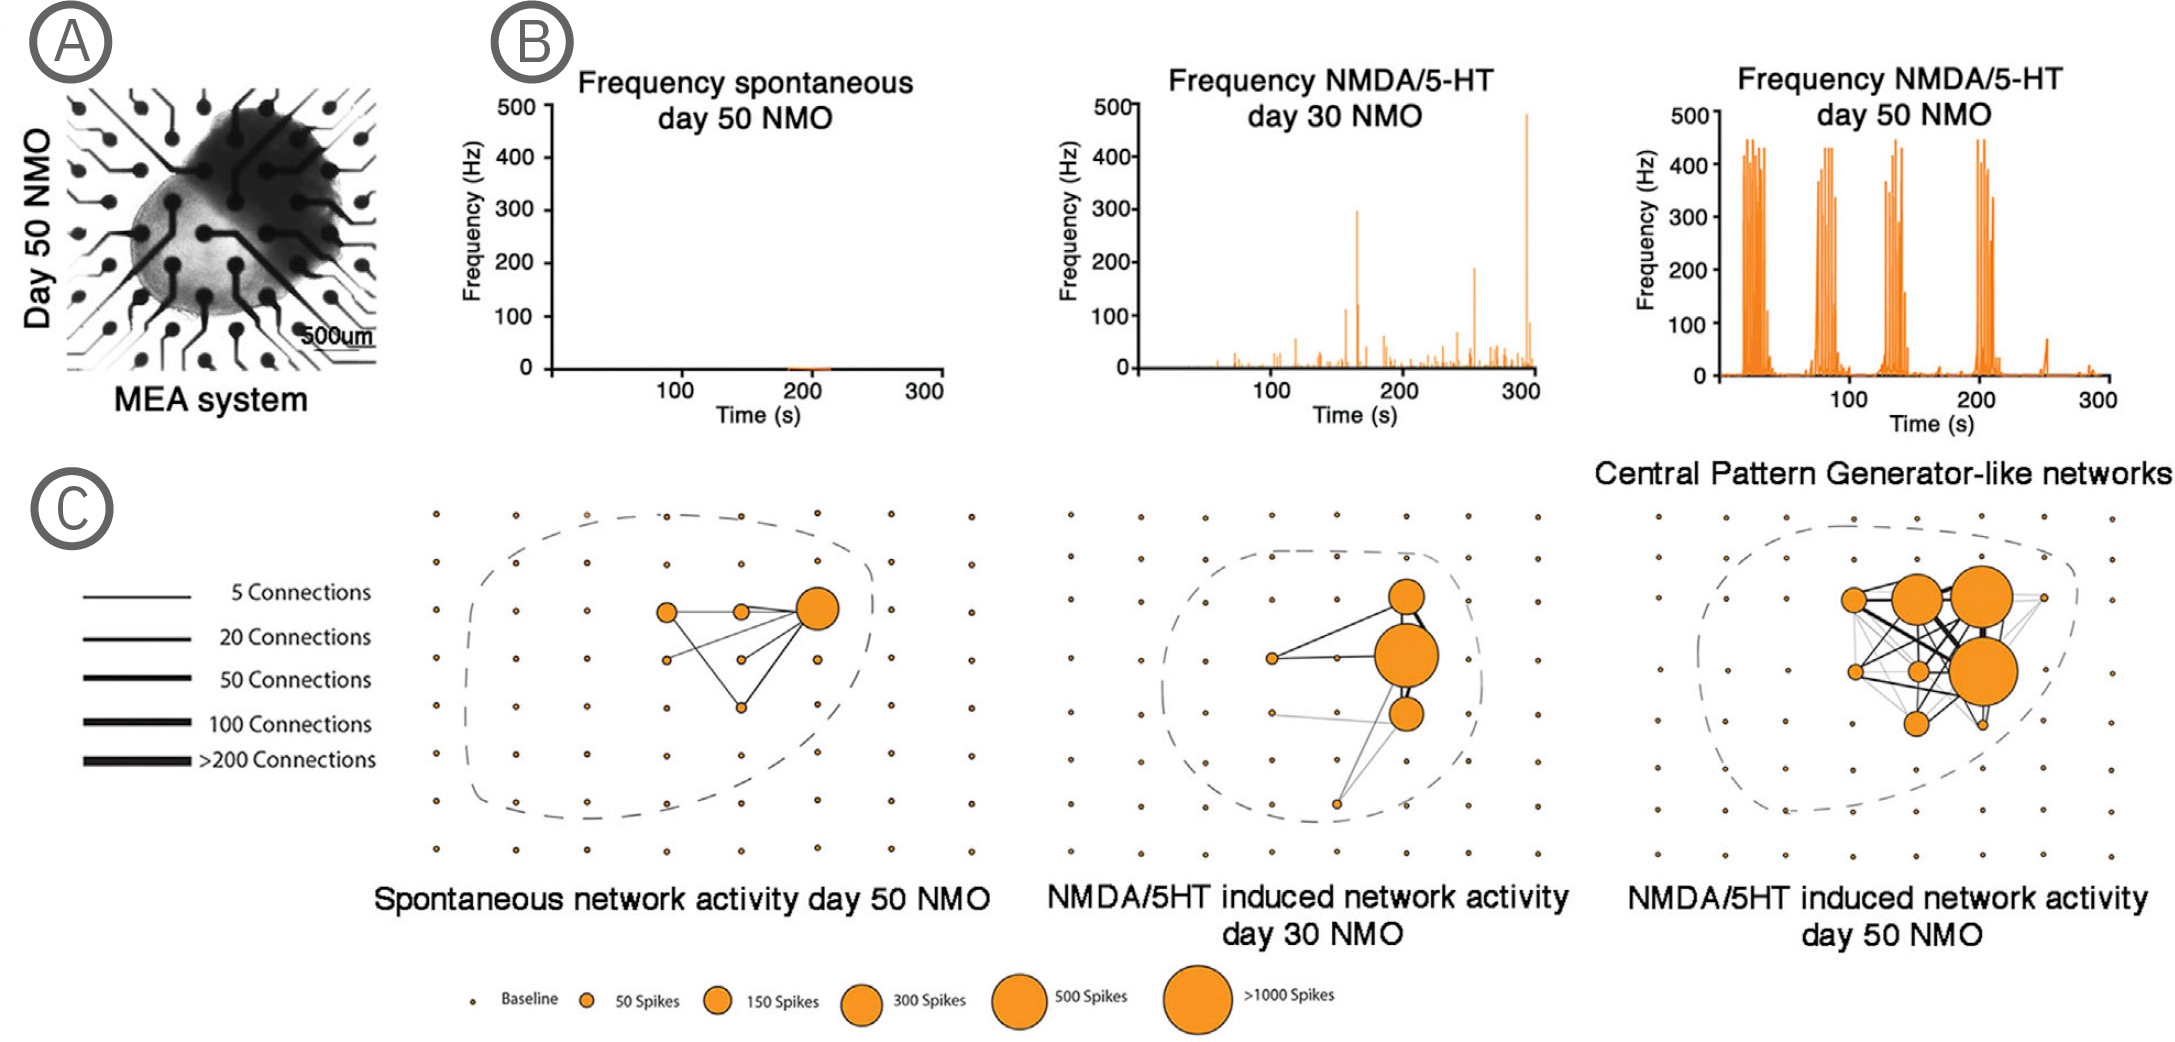
(A) Bright-field imaging of day 50 NMO in a CytoView MEA 6-well plate. (B) Plot showing the average spike frequency before (spontaneous) and after the application of 50 µM NMDA and 40 µM 5-HT in days 30 and 50 NMOs. Day 50 NMOs show central pattern generator (CPG)-like activity. (C) Network graph showing the connectivity between electrodes recording spontaneous (left) or 50 µM NMDA/40 µM 5-HT at day 30 (middle) or 50 µM NMDA/ 40 µM 5-HT at day 50 stimulated electrical activity. Line thickness represents the number of times the paired firing occurred between electrodes, while node size shows the number of spikes captured by each single electrode during a recording. The stimulation of neurons at day 50 with NMDA/5-HT showed increased single firings and an increase in paired electrode spikes. The position of the individual NMOs in the MEA grid is shown with a dashed line. The Maestro Edge MEA system was used to perform functional analysis of NMOs and strikingly demonstrated the formation of central pattern generator (CPG) like neuronal circuits. The NMO activity recorded from single electrodes in combination with a Matlab script were used to plot network graphs that highlight the formation of neuronal circuits [Faustino Martins et al. (2020), Self-Organizing 3D Human Trunk Neuromuscular Organoids. Cell Stem Cell 26: 1-15].
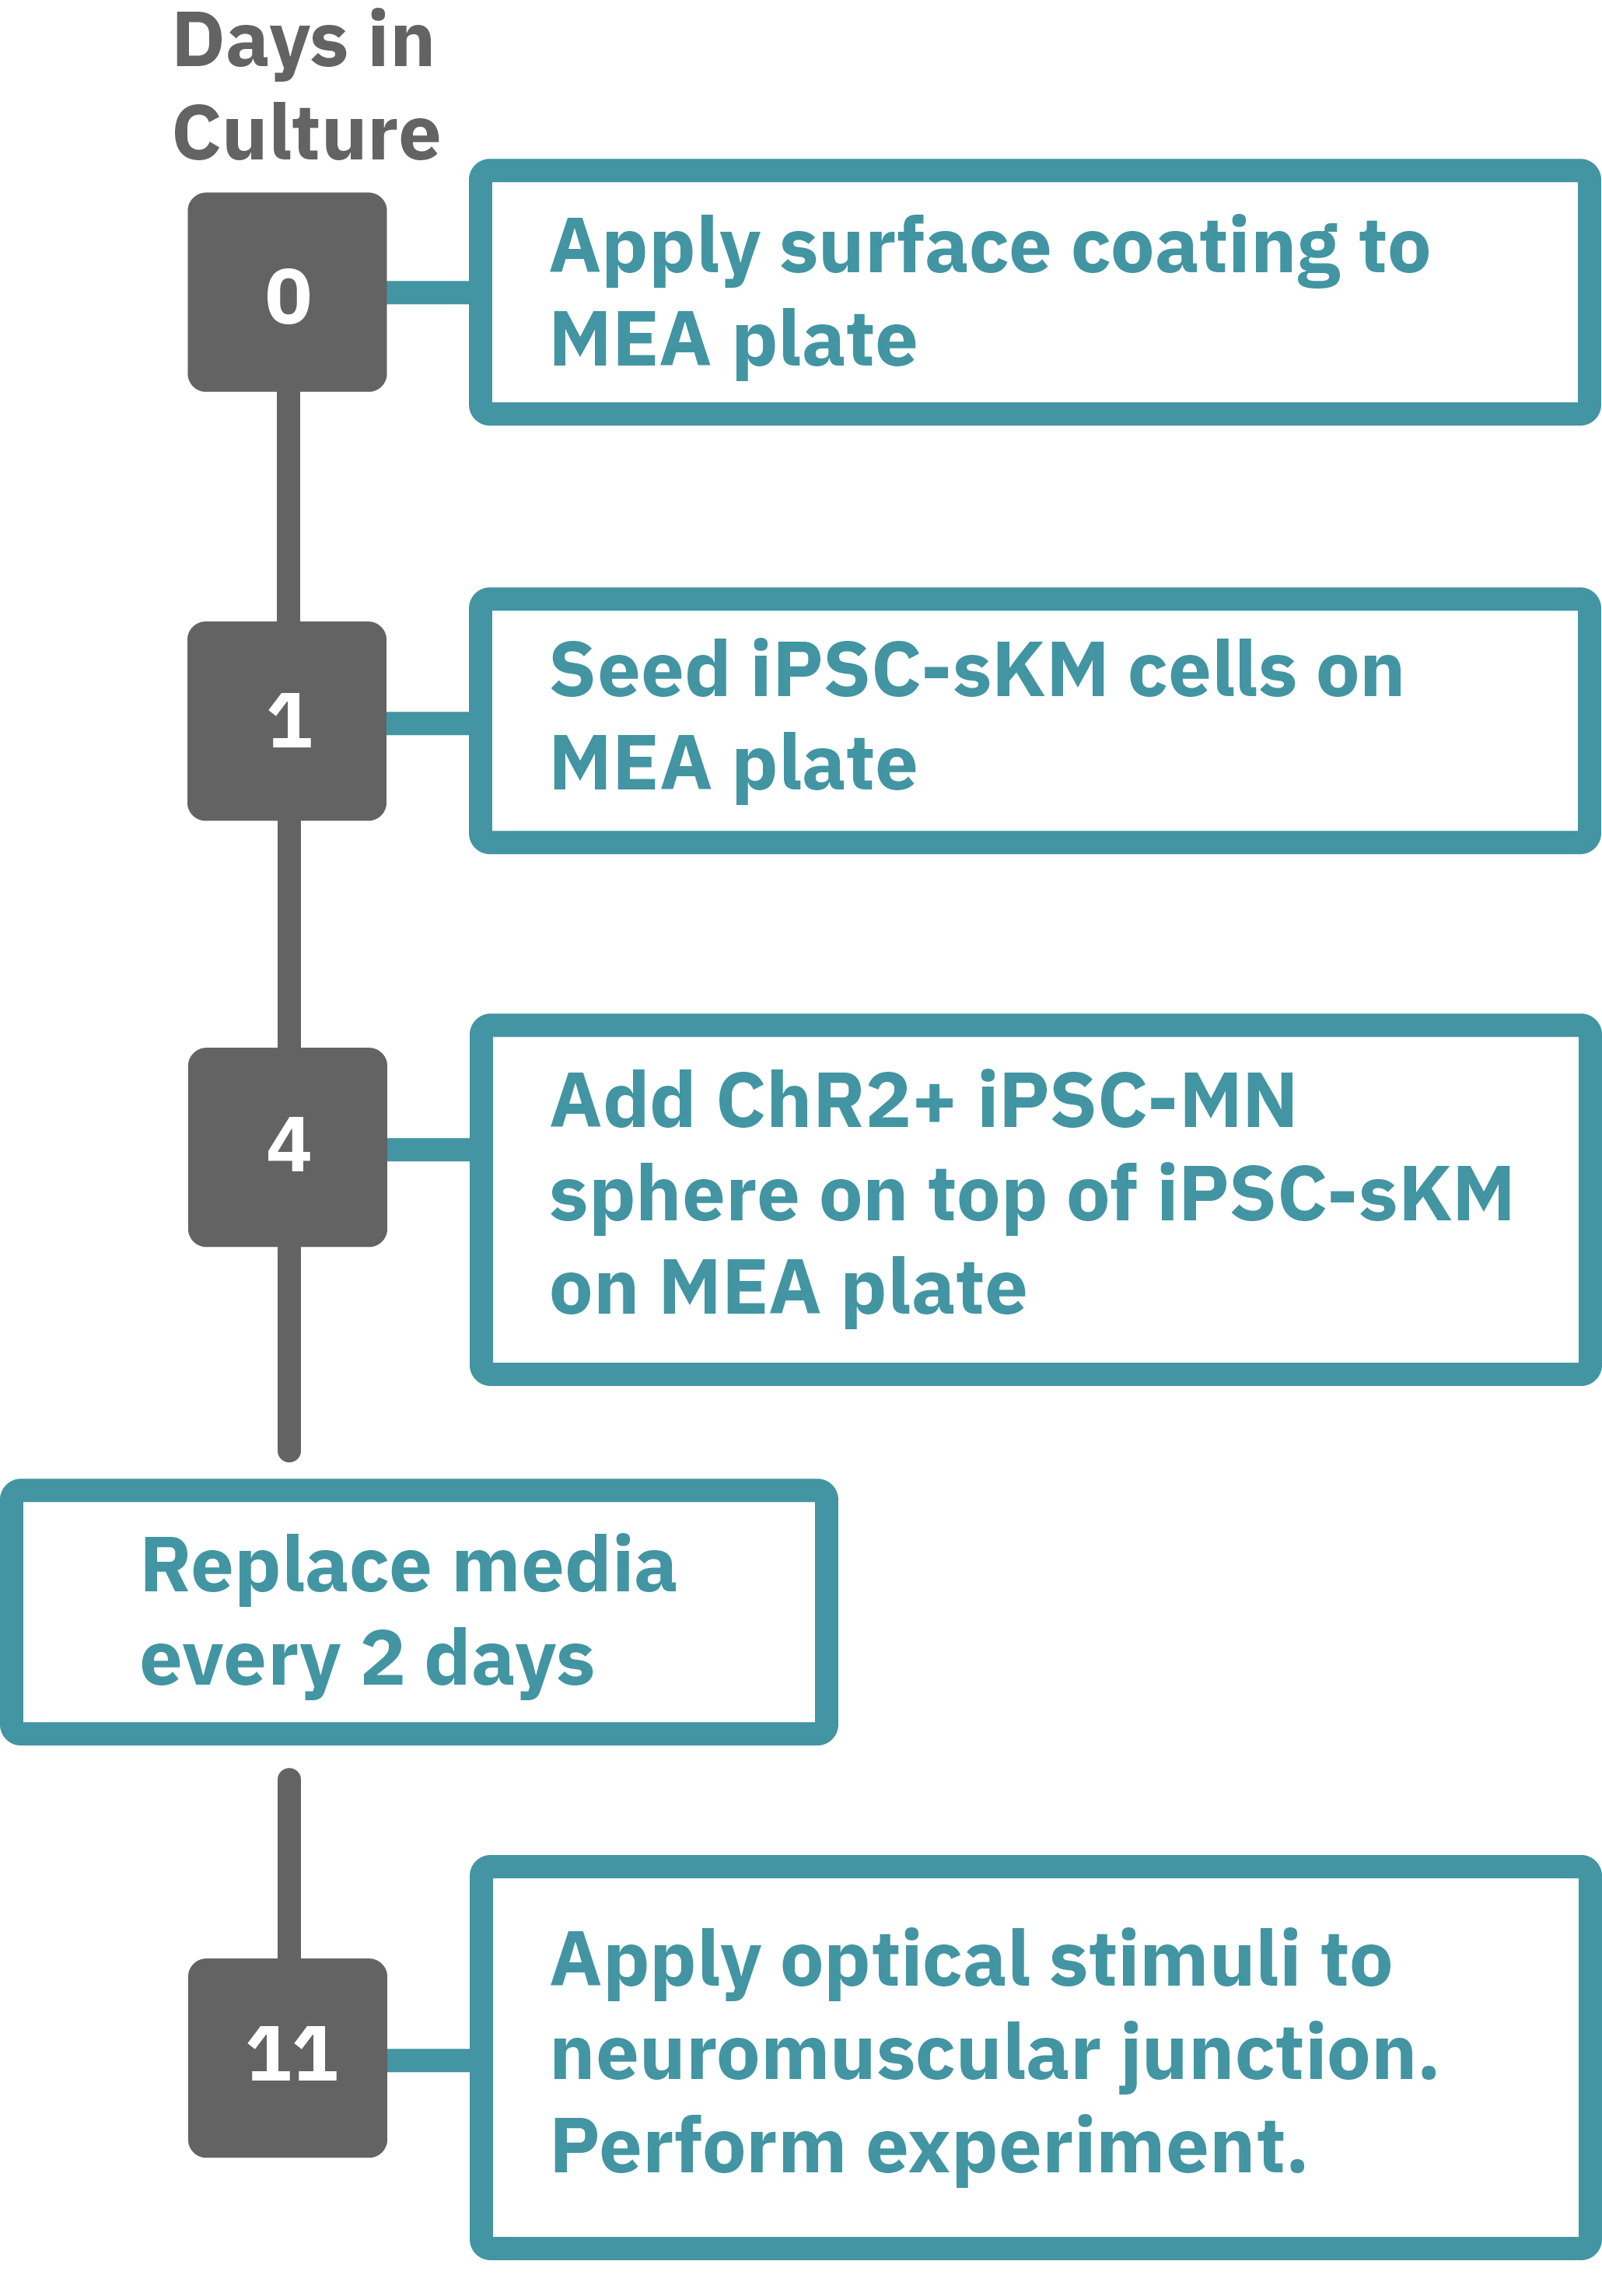
Protocol taken from Swartz et al. 2020. Previously frozen vial of iPSC- skeletal muscle (sKM) cells (day 79, isoA80) was thawed and plated onto a Lumos MEA 48 plate (Day 1). iPSC-sKMs were grown for 3 days in N2 medium and on Day 4, live iPSC-MN spheres (day 40, Opto-isoA80-8) were plated on top, creating co-cultures. Co-cultures were grown in NDM5 and ¾ medium was replaced every 48 hours with NDM6 containing recombinant human Agrin (50 ng/µL). At the time of recording, the co-culture was 7 days old (Day 9), with the last medium change occurring 48 hours prior. Optogenetic stimulation was performed with the Lumos 48 system using 475 nm light at 50% power with 500 ms pulses at 0.25 Hz. Electrophysiological activity was recorded using the Maestro Pro, and analyzed with the AxIS Navigator Neural Module software.