Liquid tumors such as leukemia, lymphoma, and myeloma are composed of non-adherent cancer cells. These free-floating liquid tumor cells represent an important target in immuno-oncology but assaying suspension cell cultures can be challenging as cells can be easily washed away or disturbed, hindering further measurements. To create more effective strategies for the treatment of blood cancers, accurate assessments of in vitro target-cell killing are critical.
-
Track liquid tumor cell proliferation in real time>
-
Measure dynamic dose-dependent killing of liquid tumor cells>
-
Validation of an impedance-based potency assay>
-
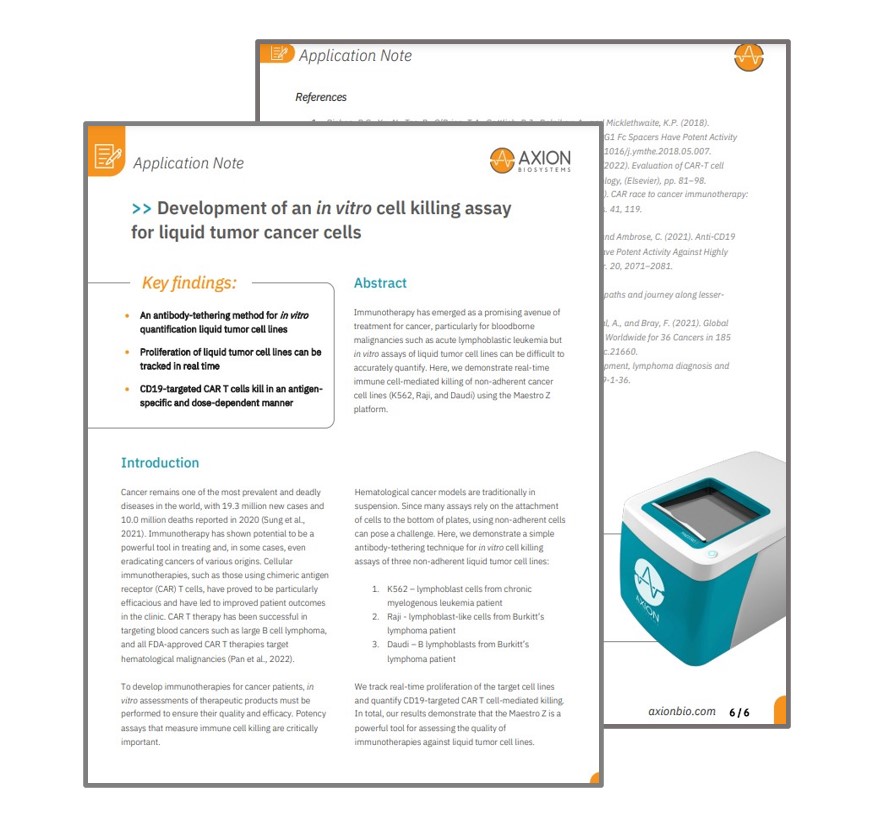
Application Note: Development of an in vitro cell killing assay for liquid tumor cancer cells>
-
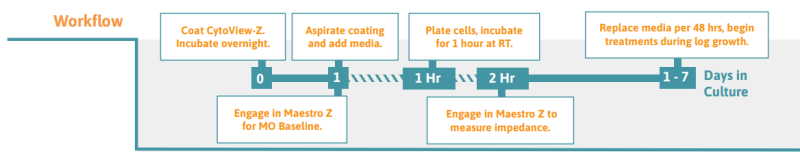
Assay Steps>
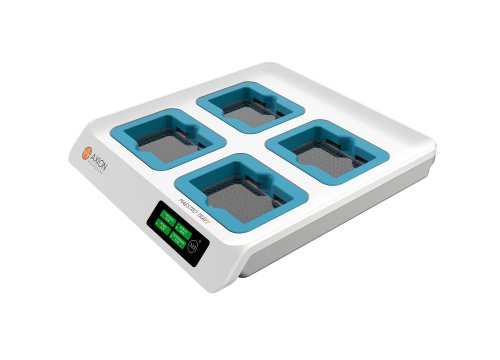
Many hematological cancer cell lines can be analyzed using the Maestro platform. Using an antibody-tethering technique to immobilize the target cells you can monitor cell growth in real time.
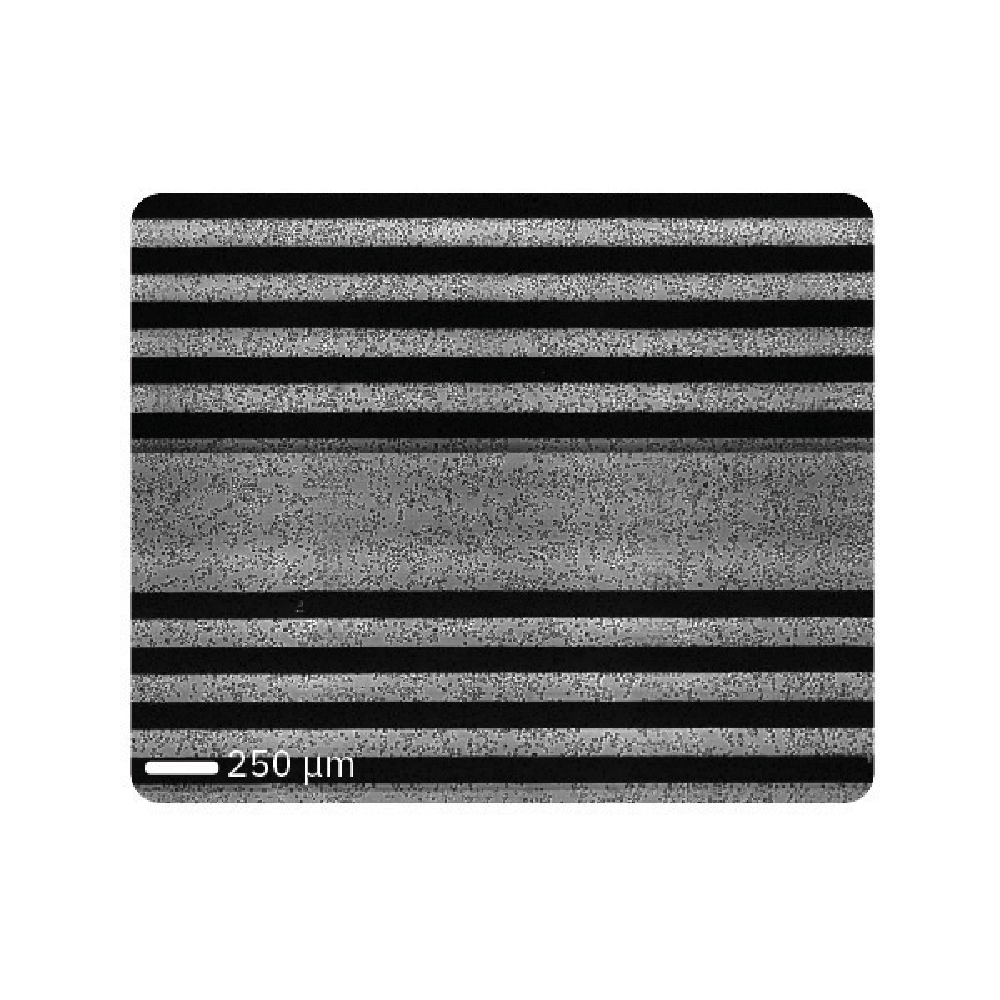
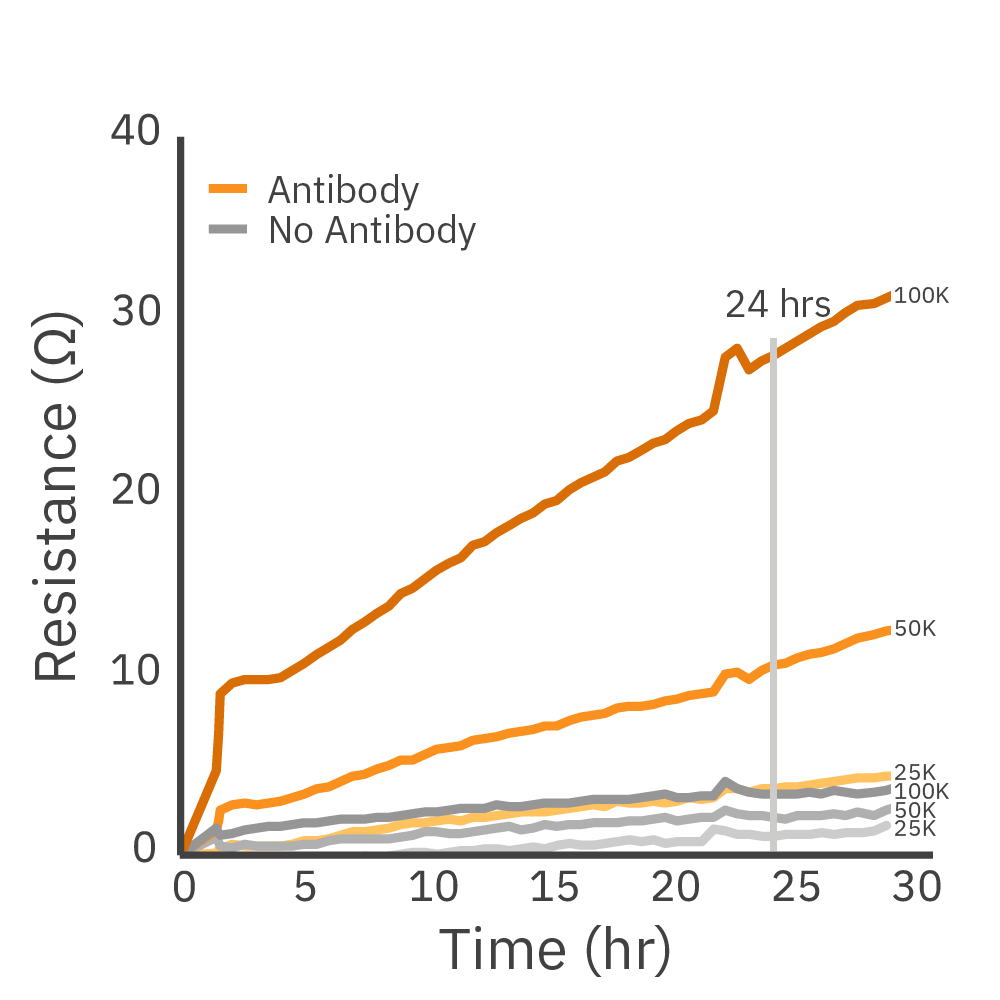
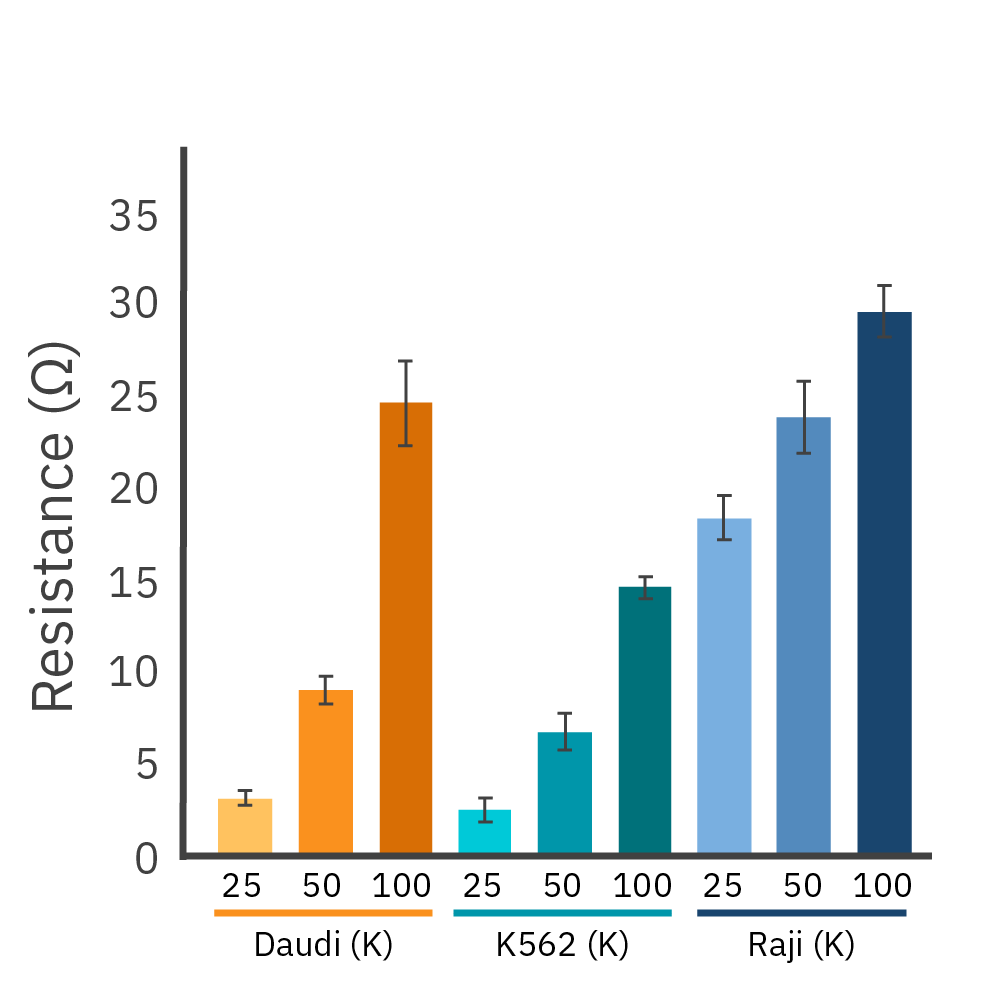
Liquid tumor cell lines can be assayed in real time. (Left) Daudi cells on a CytoView-Z 96 plate as imaged by the Omni. (Middle) Proliferation of antibody-tethered vs non-tethered Daudi cells as measured by the Maestro Z shows the increase in signal achieved with antibody-tethering. (Right) The tethering technique is broadly applicable as demonstrated in liquid tumor cell lines Daudi, K562, and Raji across a range of cell densities.
Real-time assessment can track the magnitude and rate of immune cell-mediated killing. Get a more comprehensive understanding of effector and target cell interactions with kinetic endpoints like kill time 50.
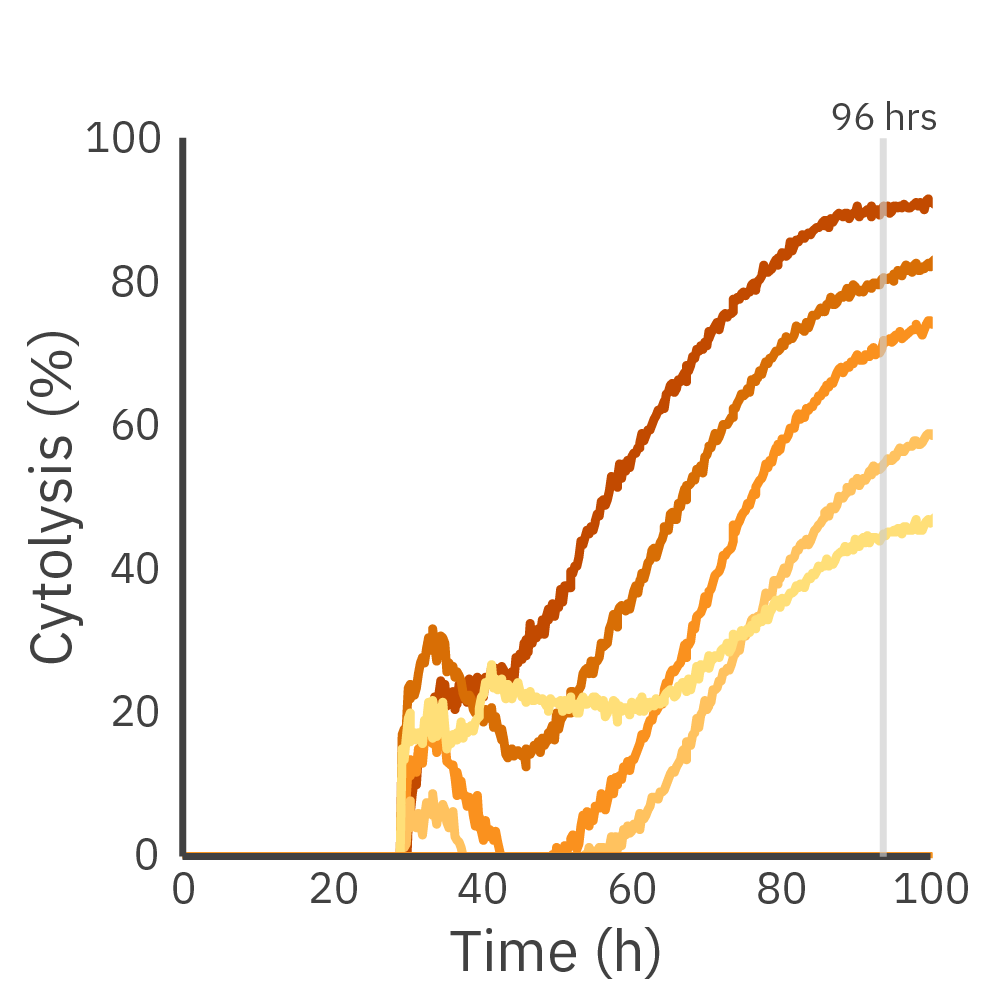
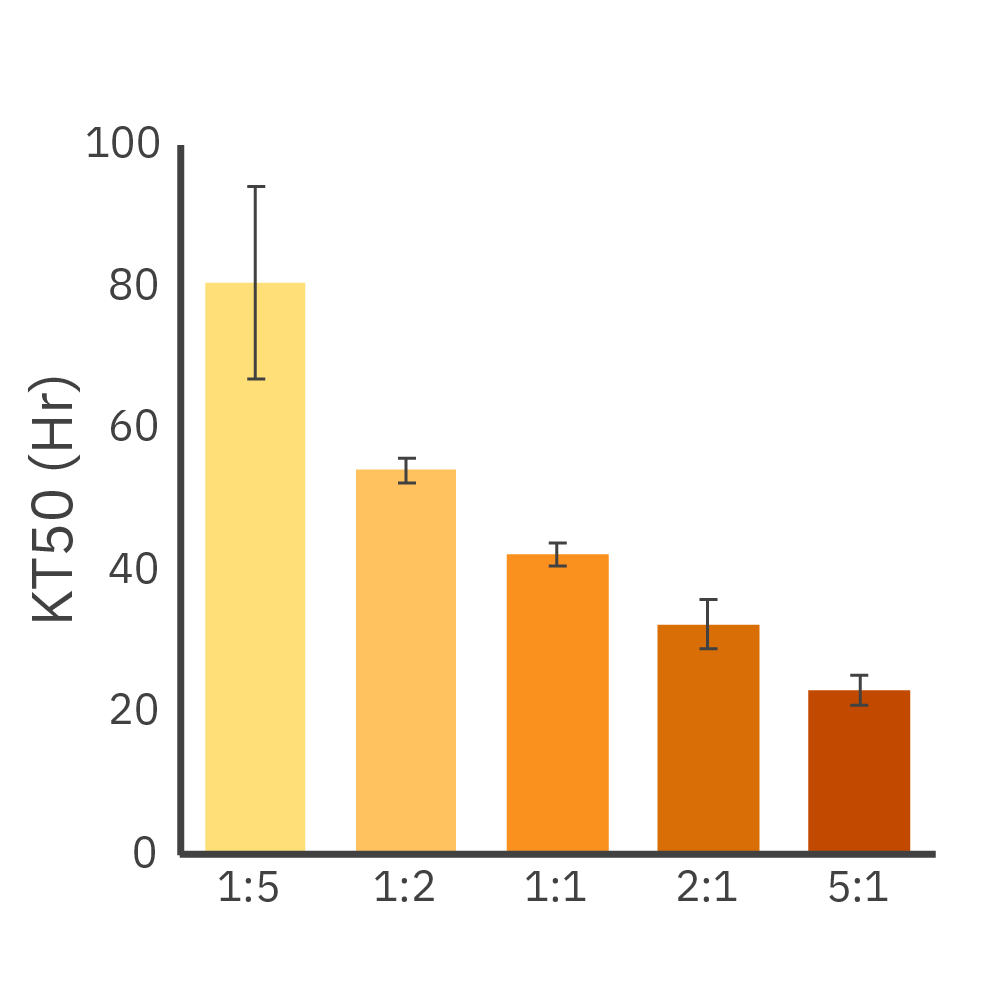
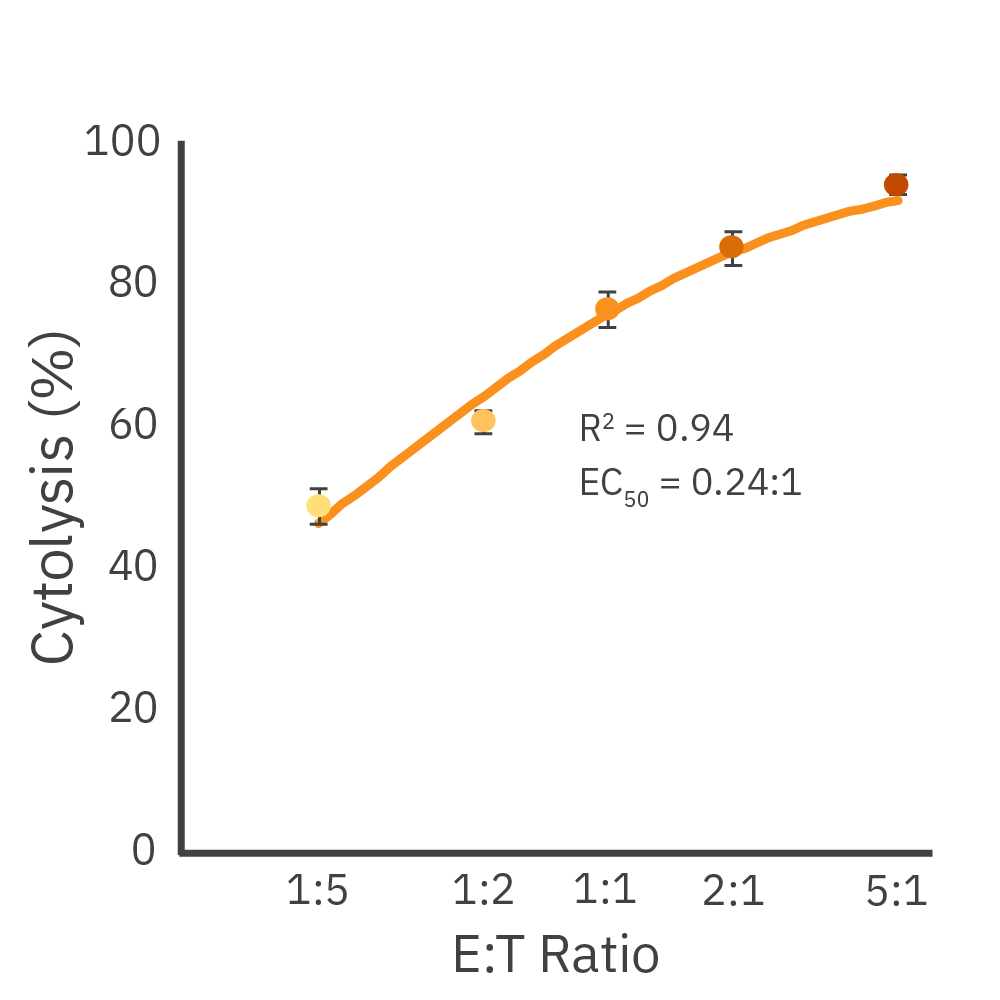
Dose-dependent killing of Daudi cells by CD19-targeted CAR T cells. (Left) Cytolysis of 50K Daudi cells dosed with CD19-targeted CAR T cells at different E:T ratios. (Middle) Kill time 50 (KT50) values for each dose. (Right) A dose-response or immune cell-mediated killing at 96 hours.
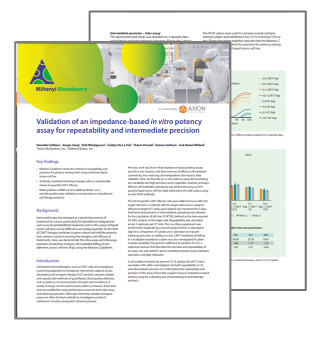
Repeatability and precision is crucial for potency testing. In this collaboration with Miltenyi Biotec, Inc, assay validation of liquid tumor cell killing was performed on the Maestro Z. For the full validation app note, click here.
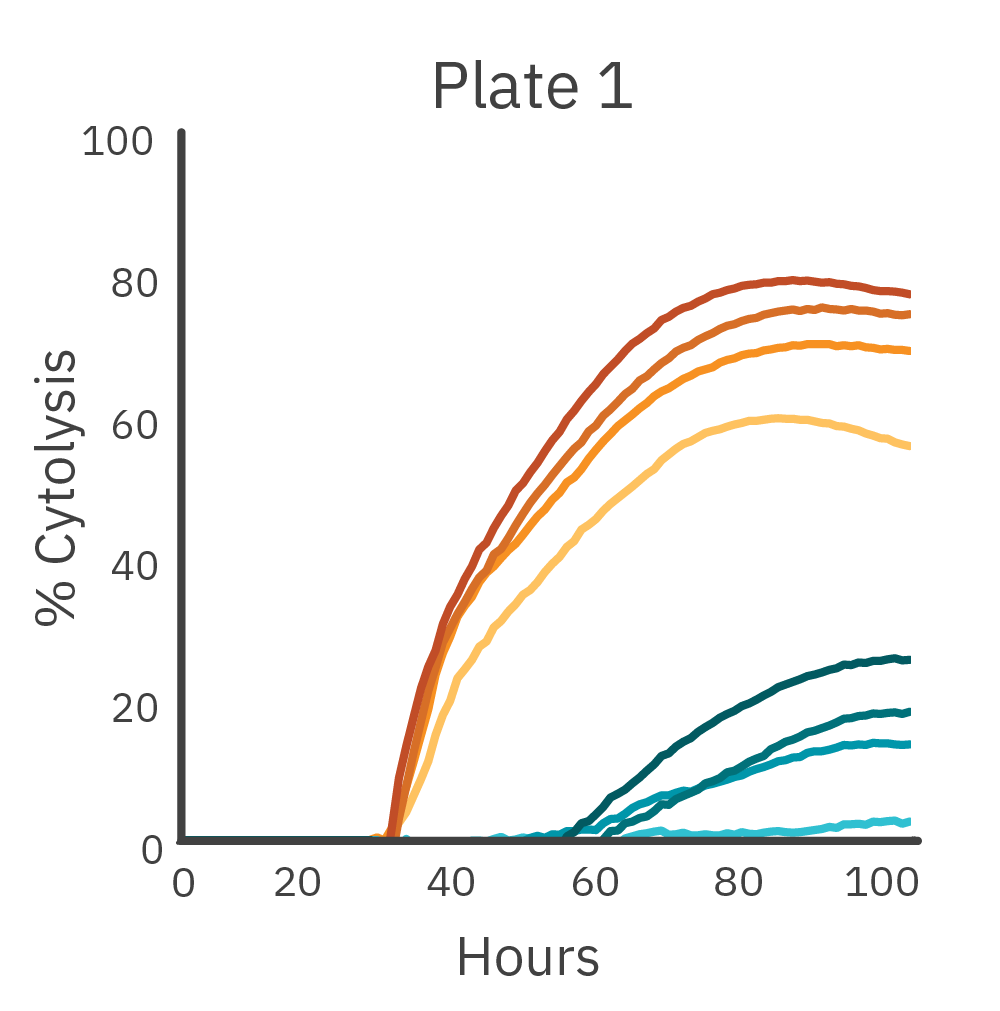
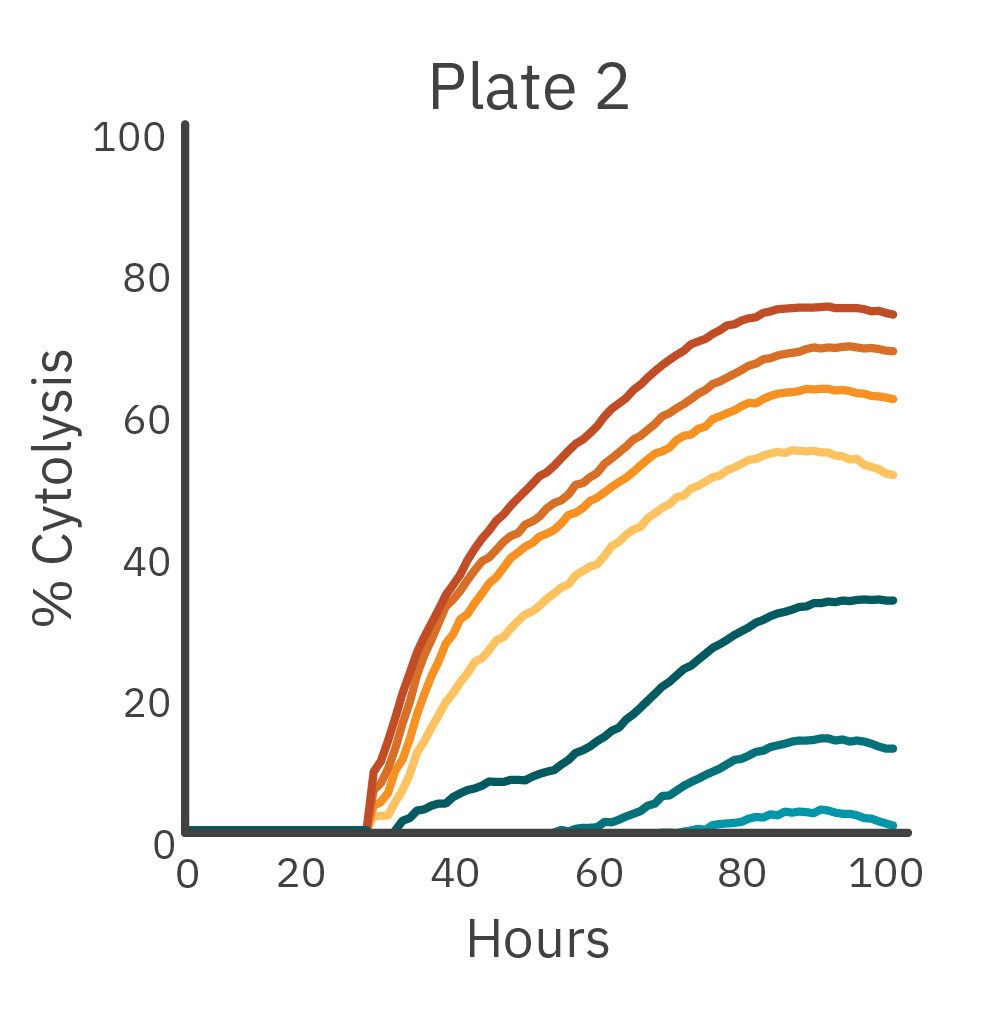
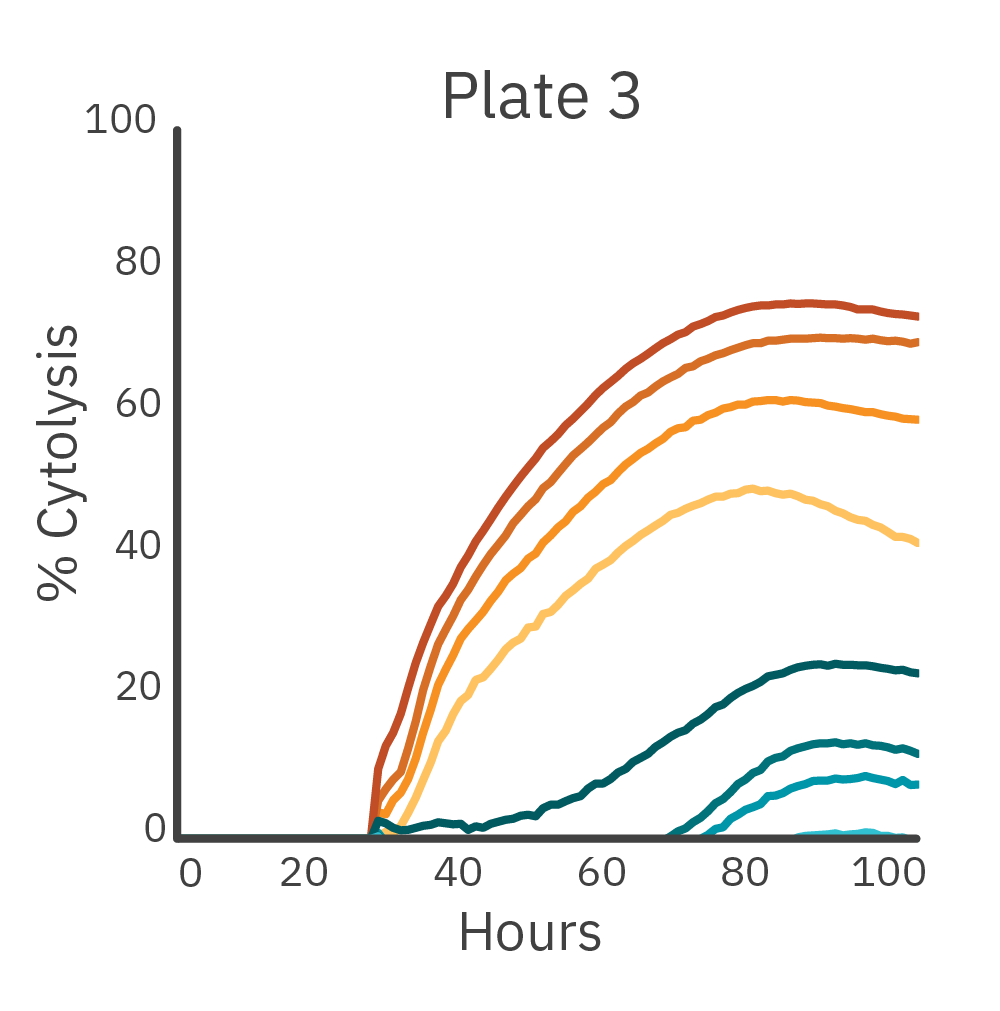

To measure the inter-assay reproducibility, cell killing (cytolysis) was measured in real time across three separate plates. CAR T and nontransduced T cells were added to antibody-tethered lymphocytes (Raji).
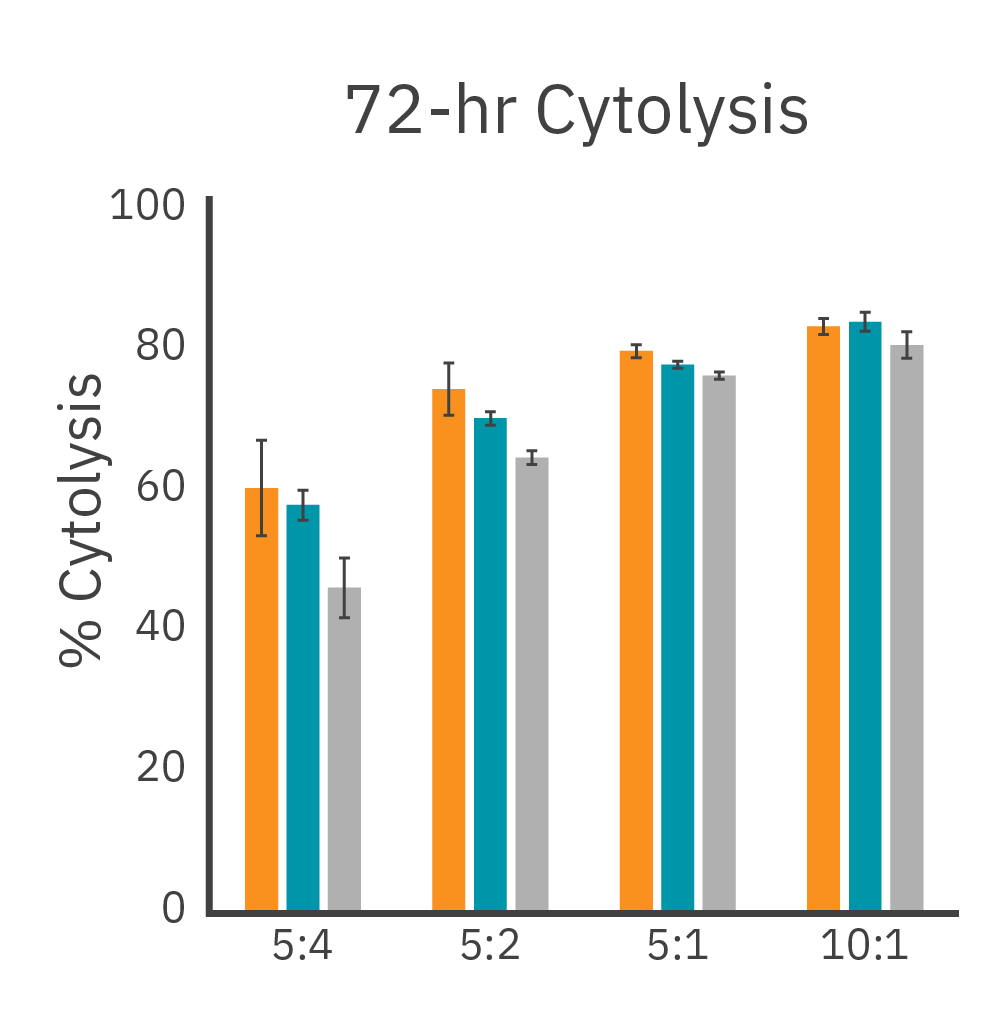
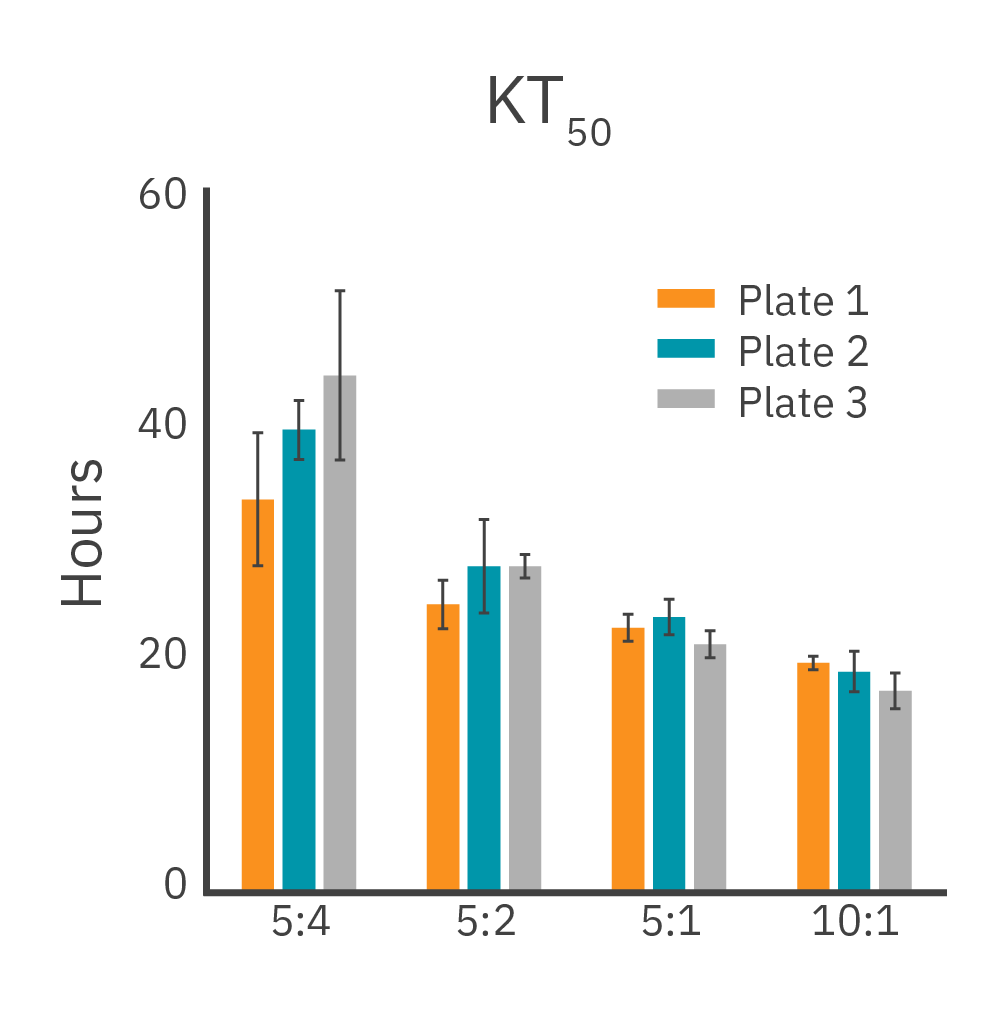
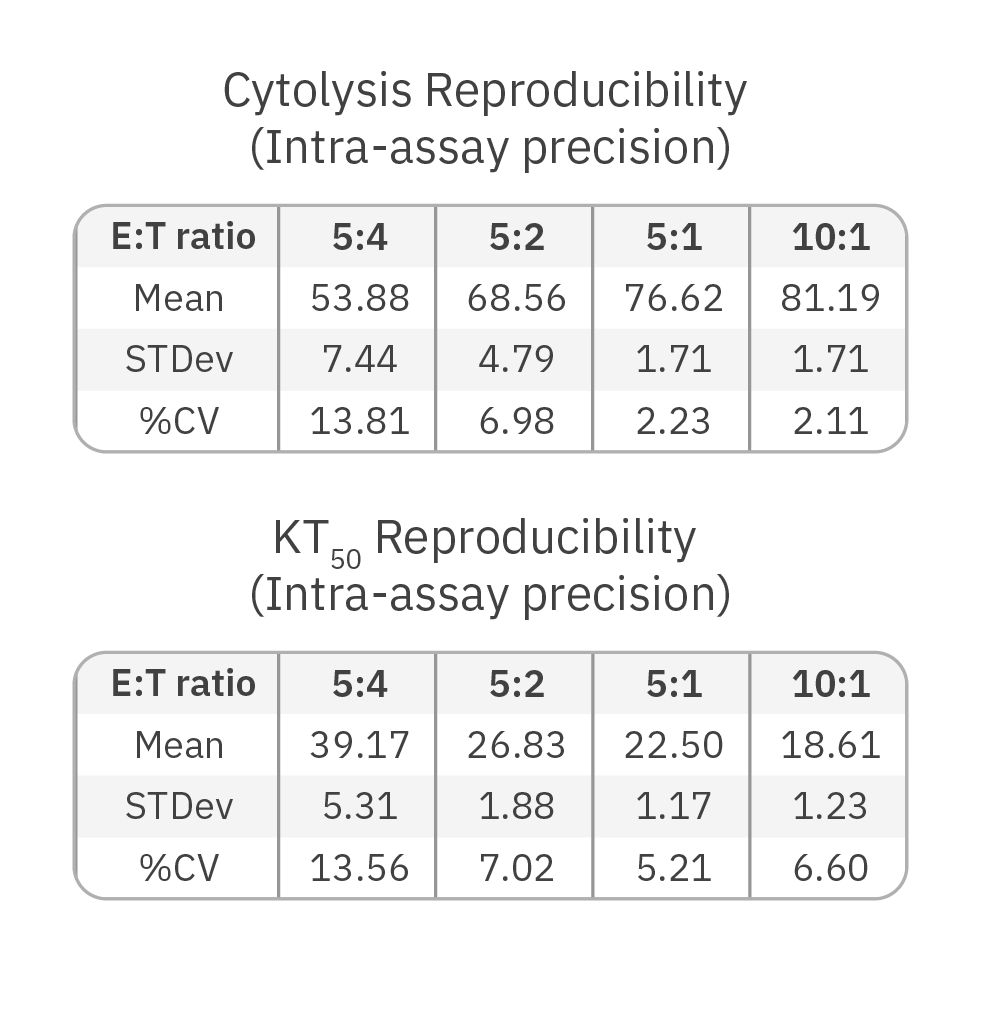
Across three plates, %CV of 72 hr. cytolysis and KT50 met the acceptance criteria of <15%.
Antibody-mediated tethering of target cells is a reproducible means to quantify CAR T efficacy. The Maestro Z platform meets the criteria for repeatability and precision for potency testing when using a tethered liquid tumor cell line. Read the full validation app note here: