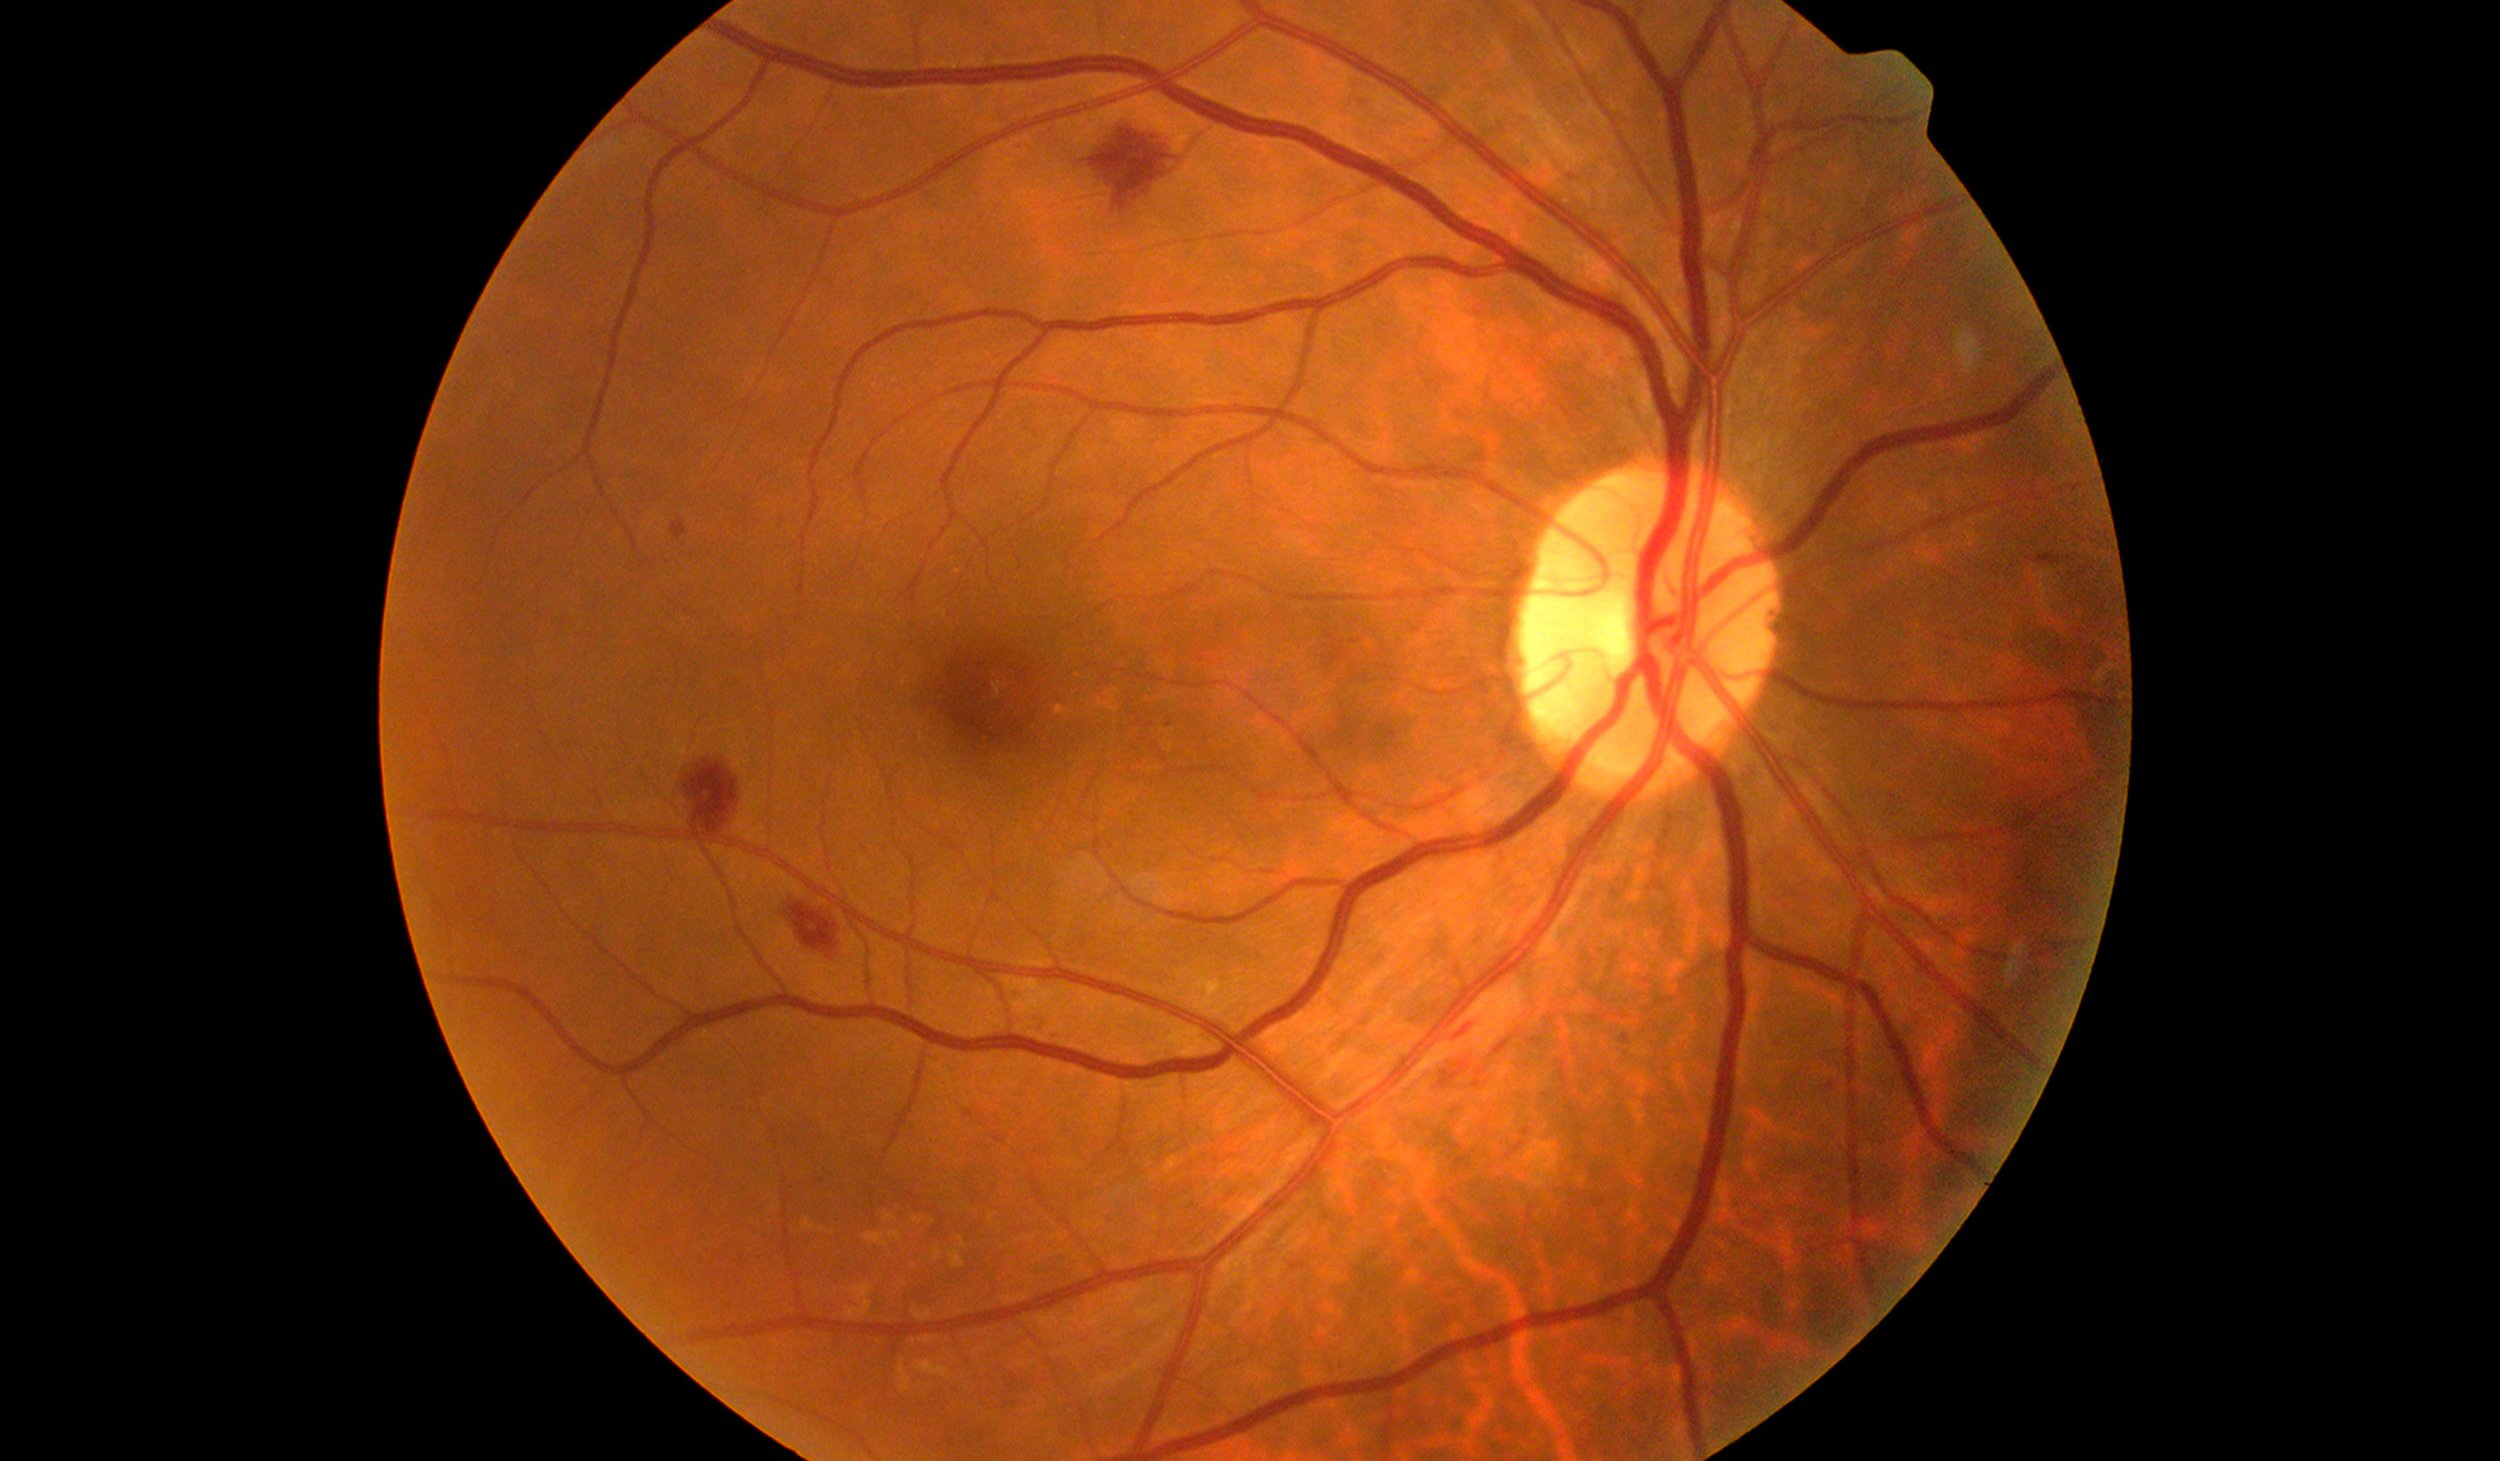
The retina is composed of a layer of light-sensitive cells at the back of the eye that transmit electrical signals via the optic nerve to the brain. Retinal degradation is characterized by the progressive death of these cells due to physical damage or genetic factors of which there is currently no cure. An important example of a progressive neurodegenerative disorder is retinitis pigmentosa which results in the initial loss of rod photoreceptor cells and eventually cone cells, the foundation of human vision. Current research has focused on the development of pharmacological compounds that act to reduce photoreceptor degradation.
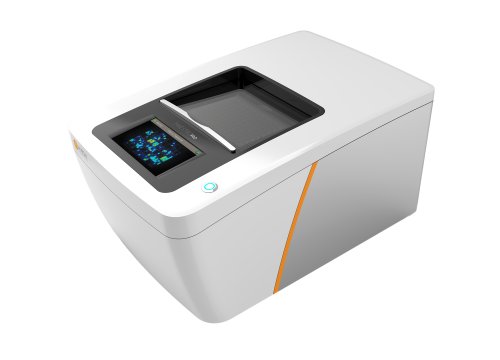
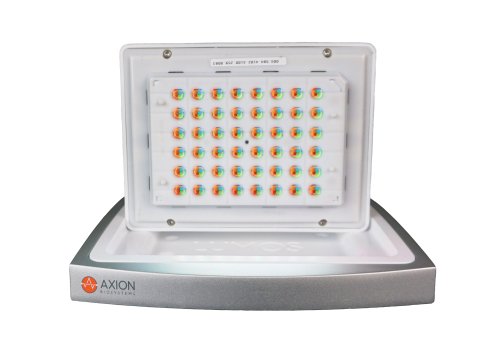
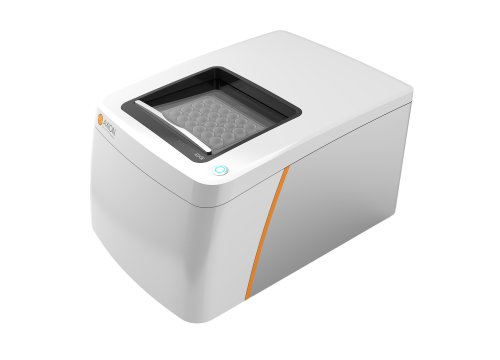
The Maestro Pro and Edge MEA platforms provide noninvasive electrical activity recordings across neural networks, while the Lumos optical stimulation system delivers precisely controlled light. Together, these devices seamlessly pair to unlock entirely new assay capabilities for retinal applications in a high-throughput format.
Electrophysiological recordings from retinal ganglion cells
Antipsychotic drugs haloperidol and clozapine have been reported to increase the sensitivity of retinal ganglion cells (RGCs) to flashes of light in the P23H rat model of retinitis pigmentosa. In order to better understand the effects of these antipsychotic drugs on the visual responses of P23H rat RGCs, Jensen (2019) examined the responses of RGCs to a drifting sinusoidal grating of various contrasts. In vitro multielectrode array recordings were made from P23H rat RGCs and healthy Sprague-Dawley (SD) rat RGCs.
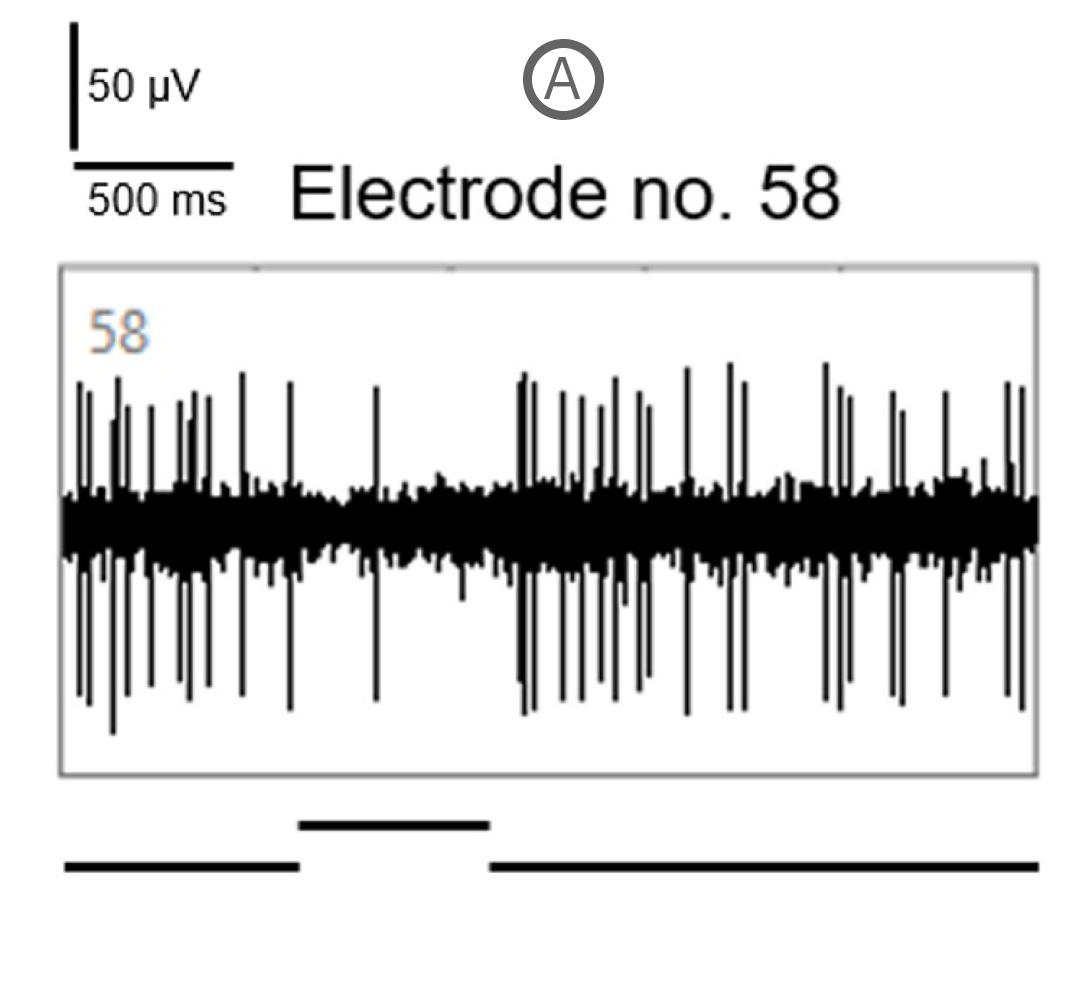
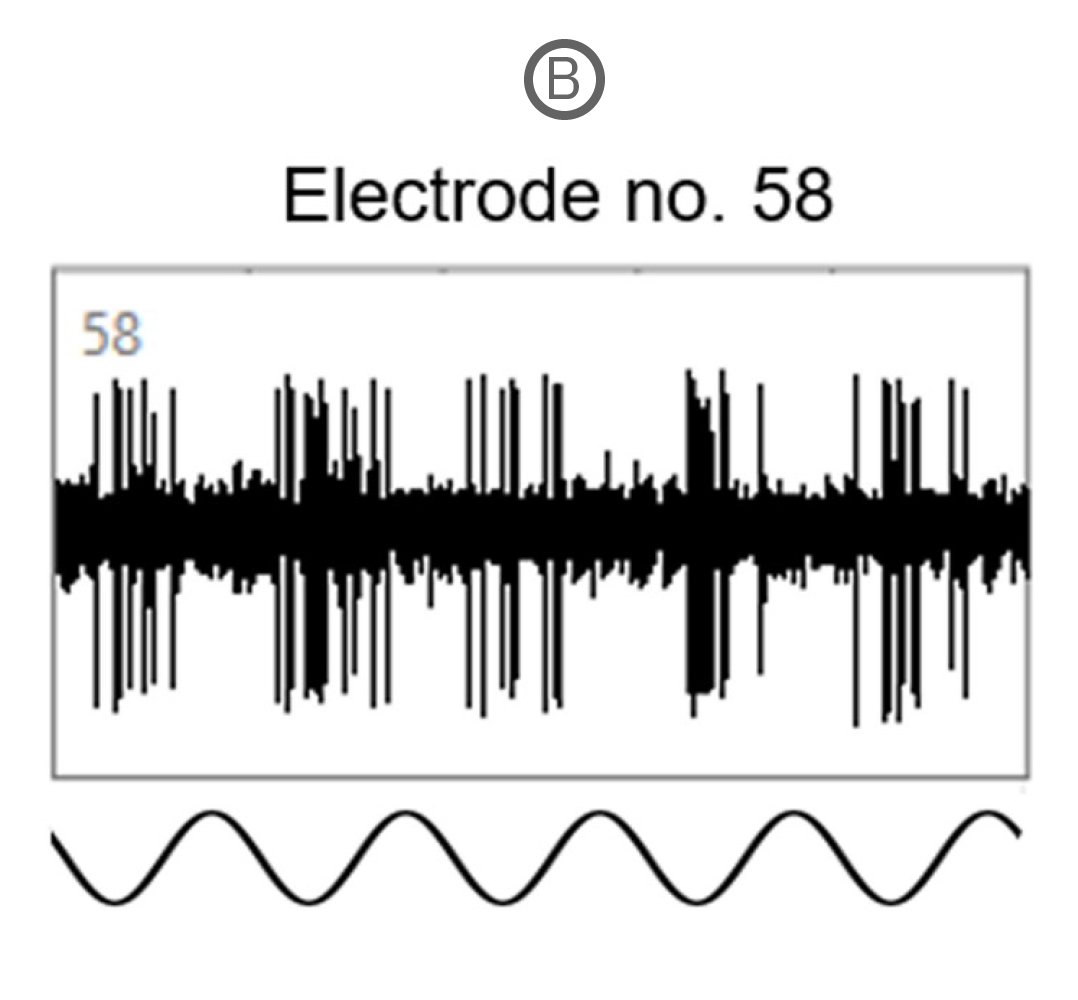
Spike activity of many SD and P23H rat RGCs was modulated by the full-field drifting sinusoidal grating (spatial frequency: 1 cycle/mm, temporal frequency: 2 cycles/s). Example recordings here show a RGC response to a full-field flash of light (A) and to the drifting sinusoidal grating (B).
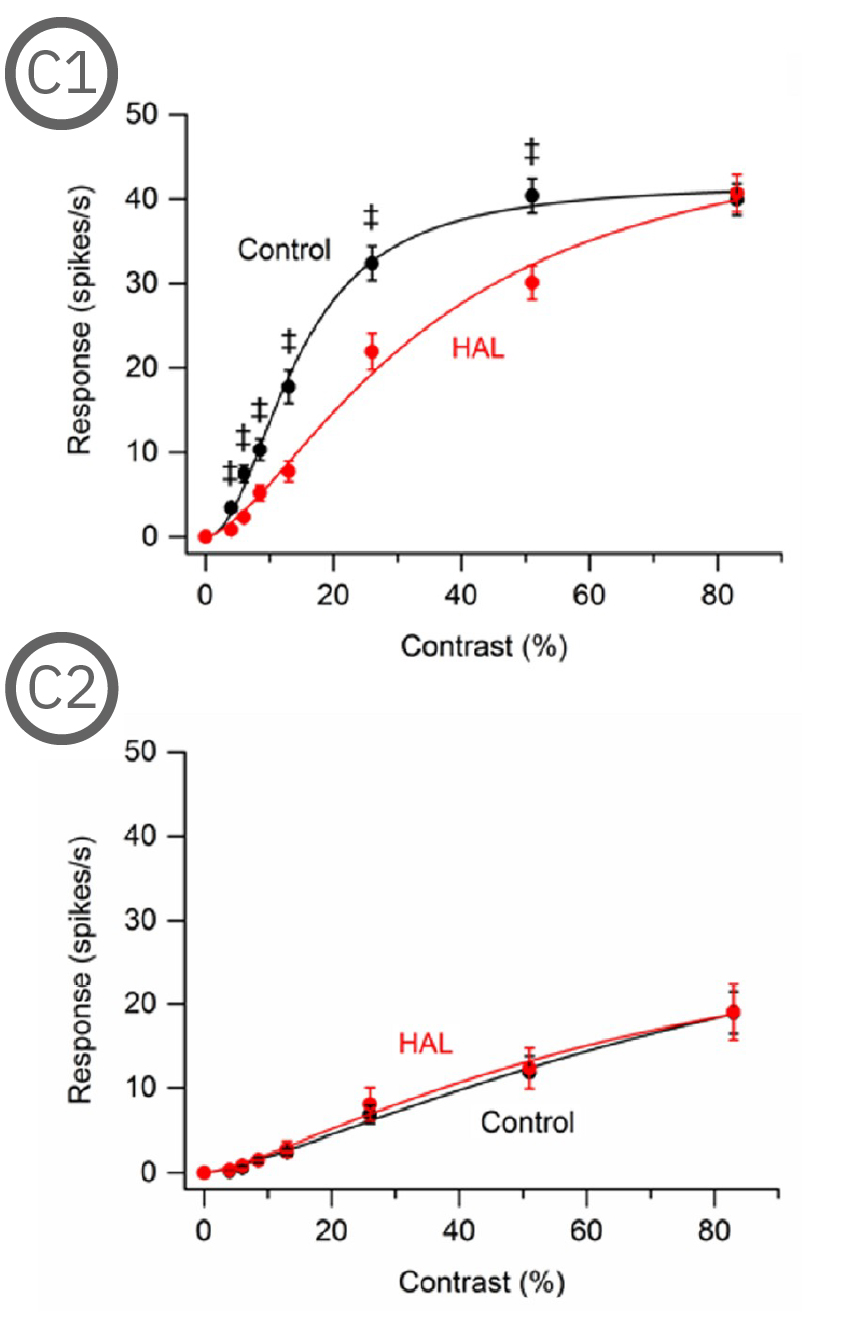
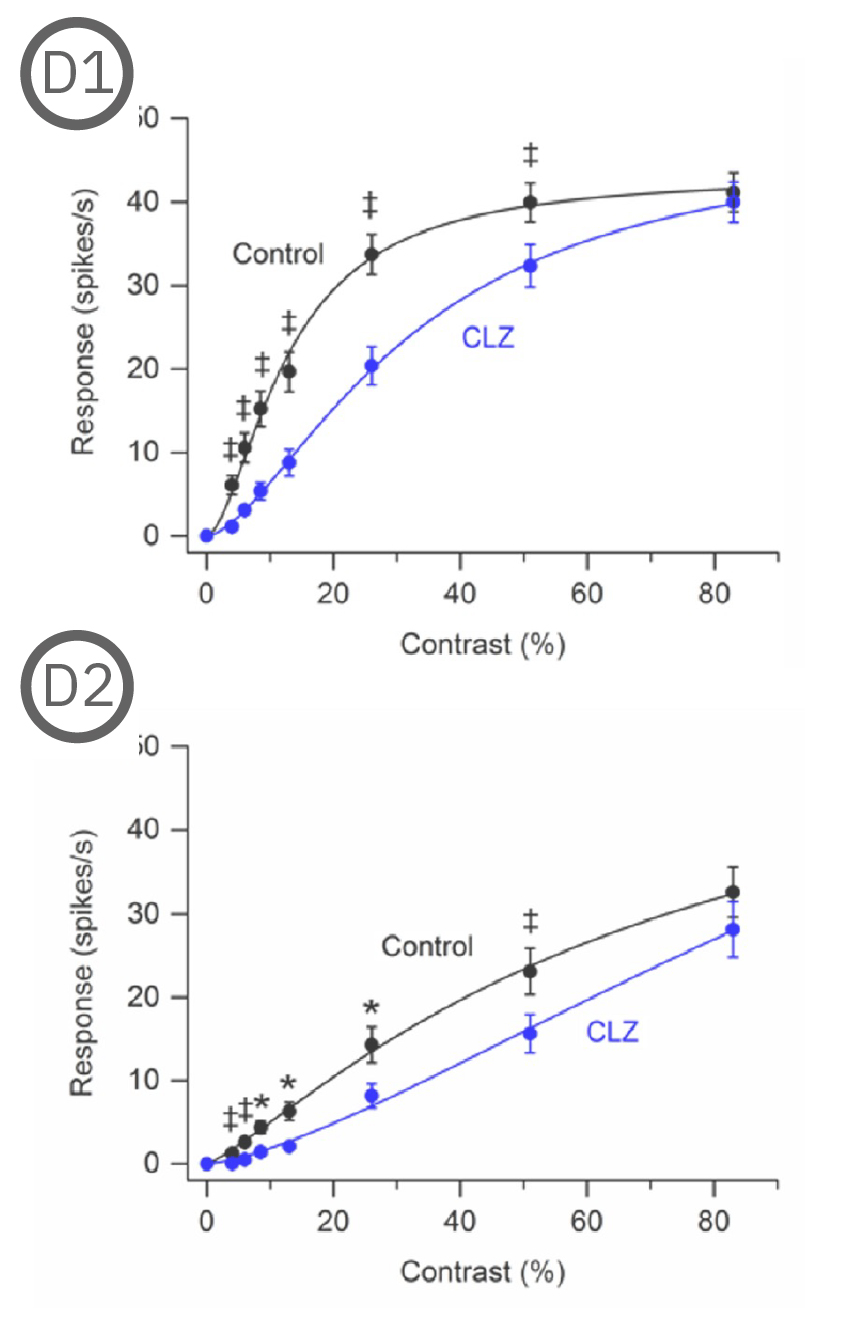
Most (73%) P23H rat RGCs could be categorized as either saturating or non-saturating cells. The remaining ‘uncategorized’ cells were poorly responsive to the drifting grating and were analyzed separately. Haloperidol and clozapine increased the responses of non-saturating (C2, D2) and uncategorized (C3, D3) P23H rat RGCs to most grating contrasts, including the highest contrast tested. Haloperidol and clozapine also increased the responses of saturating P23H rat RGCs to most grating contrasts but these increases were not statistically significant (C1, D1). Overall, the findings show that haloperidol and clozapine have differential effects on the contrast response functions of SD and P23H rat RGCs [Jensen et al. 2019].
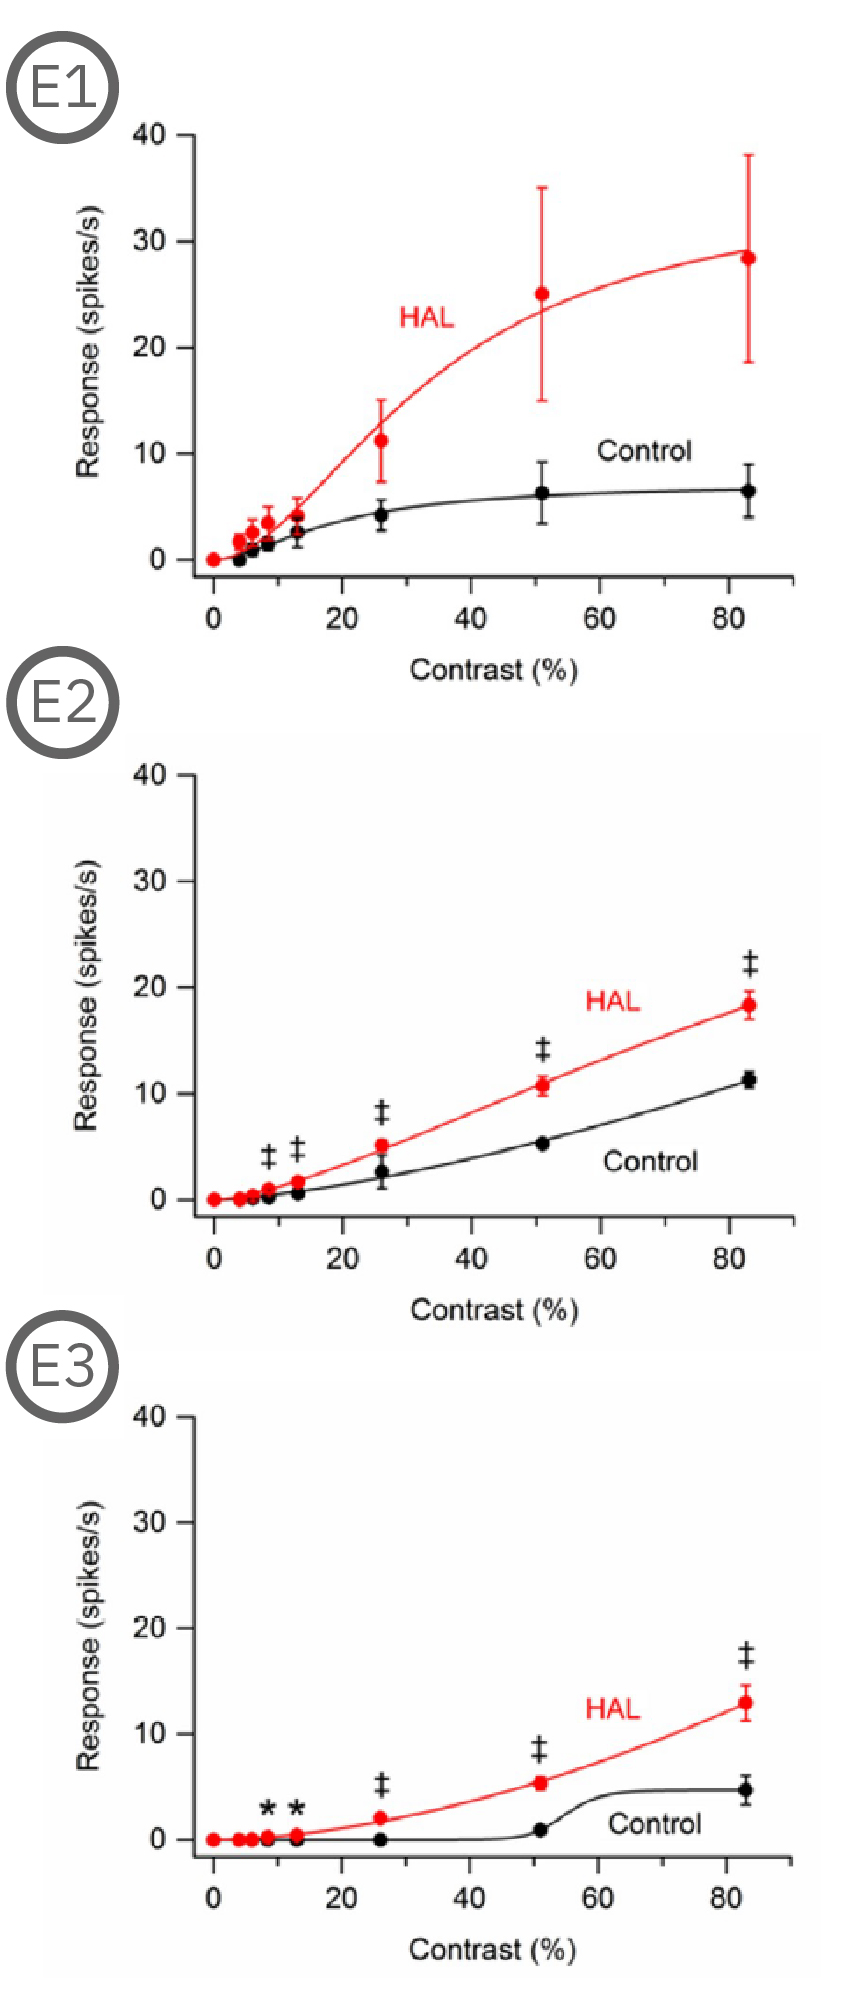
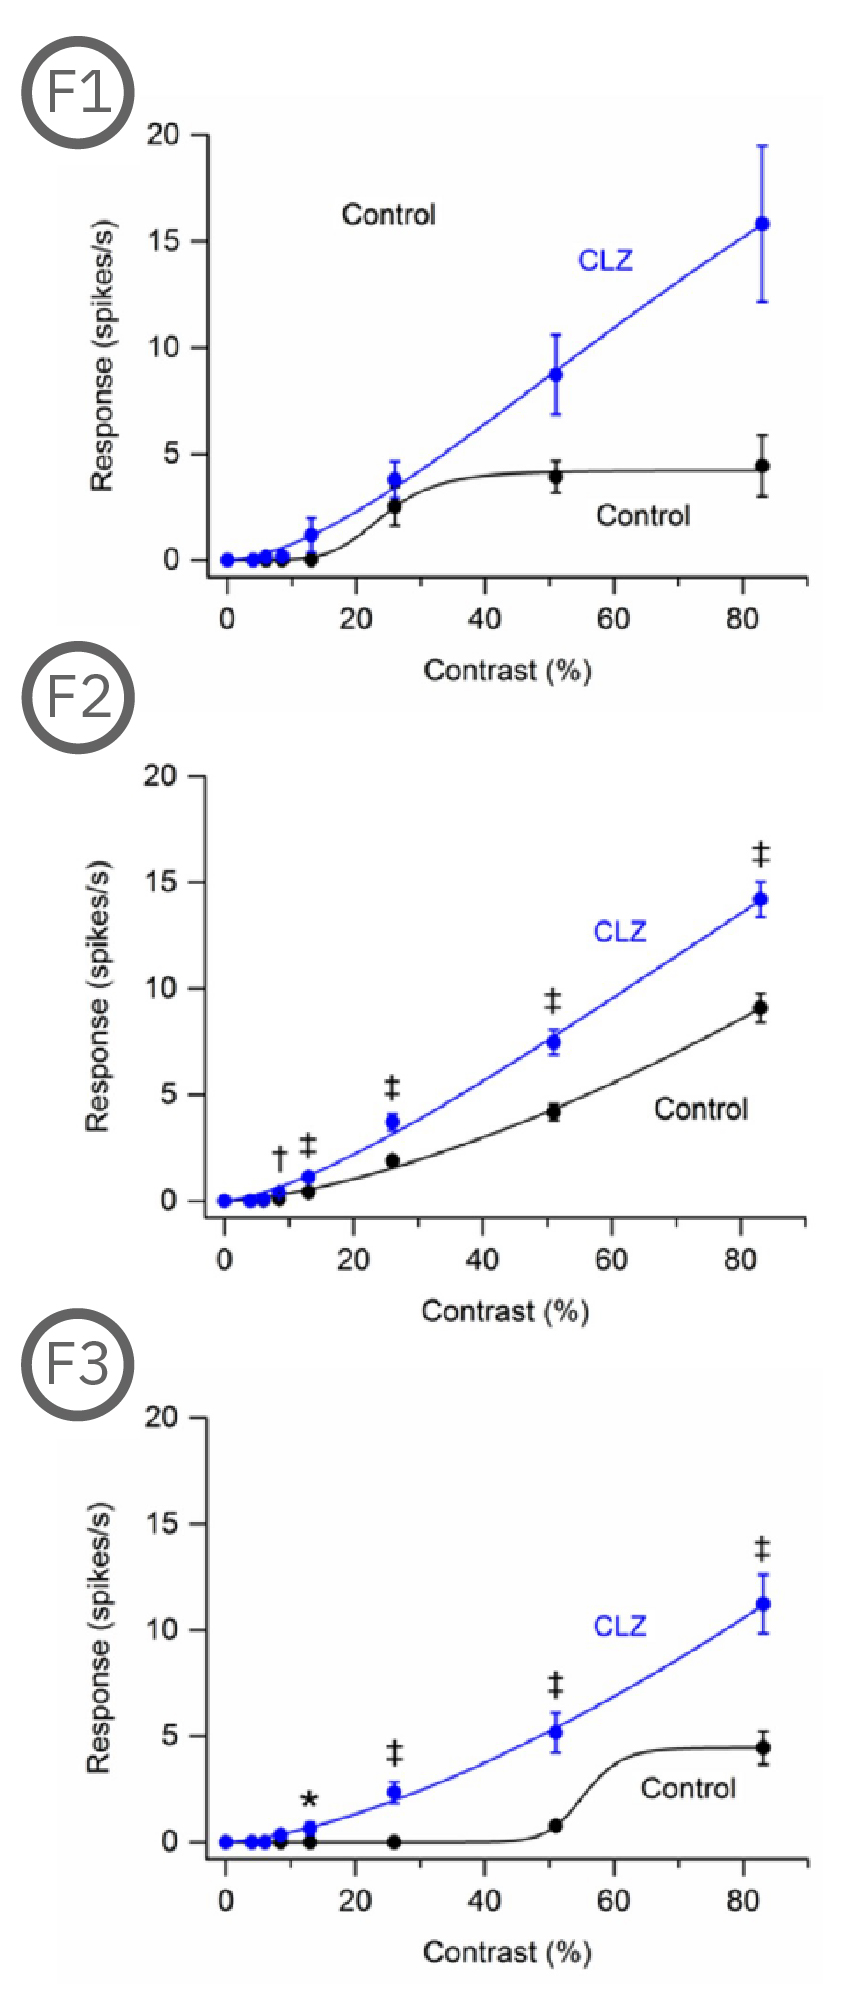
Most (73%) P23H rat RGCs could be categorized as either saturating or non-saturating cells. The remaining ‘uncategorized’ cells were poorly responsive to the drifting grating and were analyzed separately. Haloperidol and clozapine increased the responses of non-saturating (A2, B2) and uncategorized (A3, B3) P23H rat RGCs to most grating contrasts, including the highest contrast tested. Haloperidol and clozapine also increased the responses of saturating P23H rat RGCs to most grating contrasts but these increases were not statistically significant (A1, B1).
Overall, the findings show that haloperidol and clozapine have differential effects on the contrast response functions of SD and P23H rat RGCs. Data courtesy of Ralph Jensen (VA Boston Healthcare System).
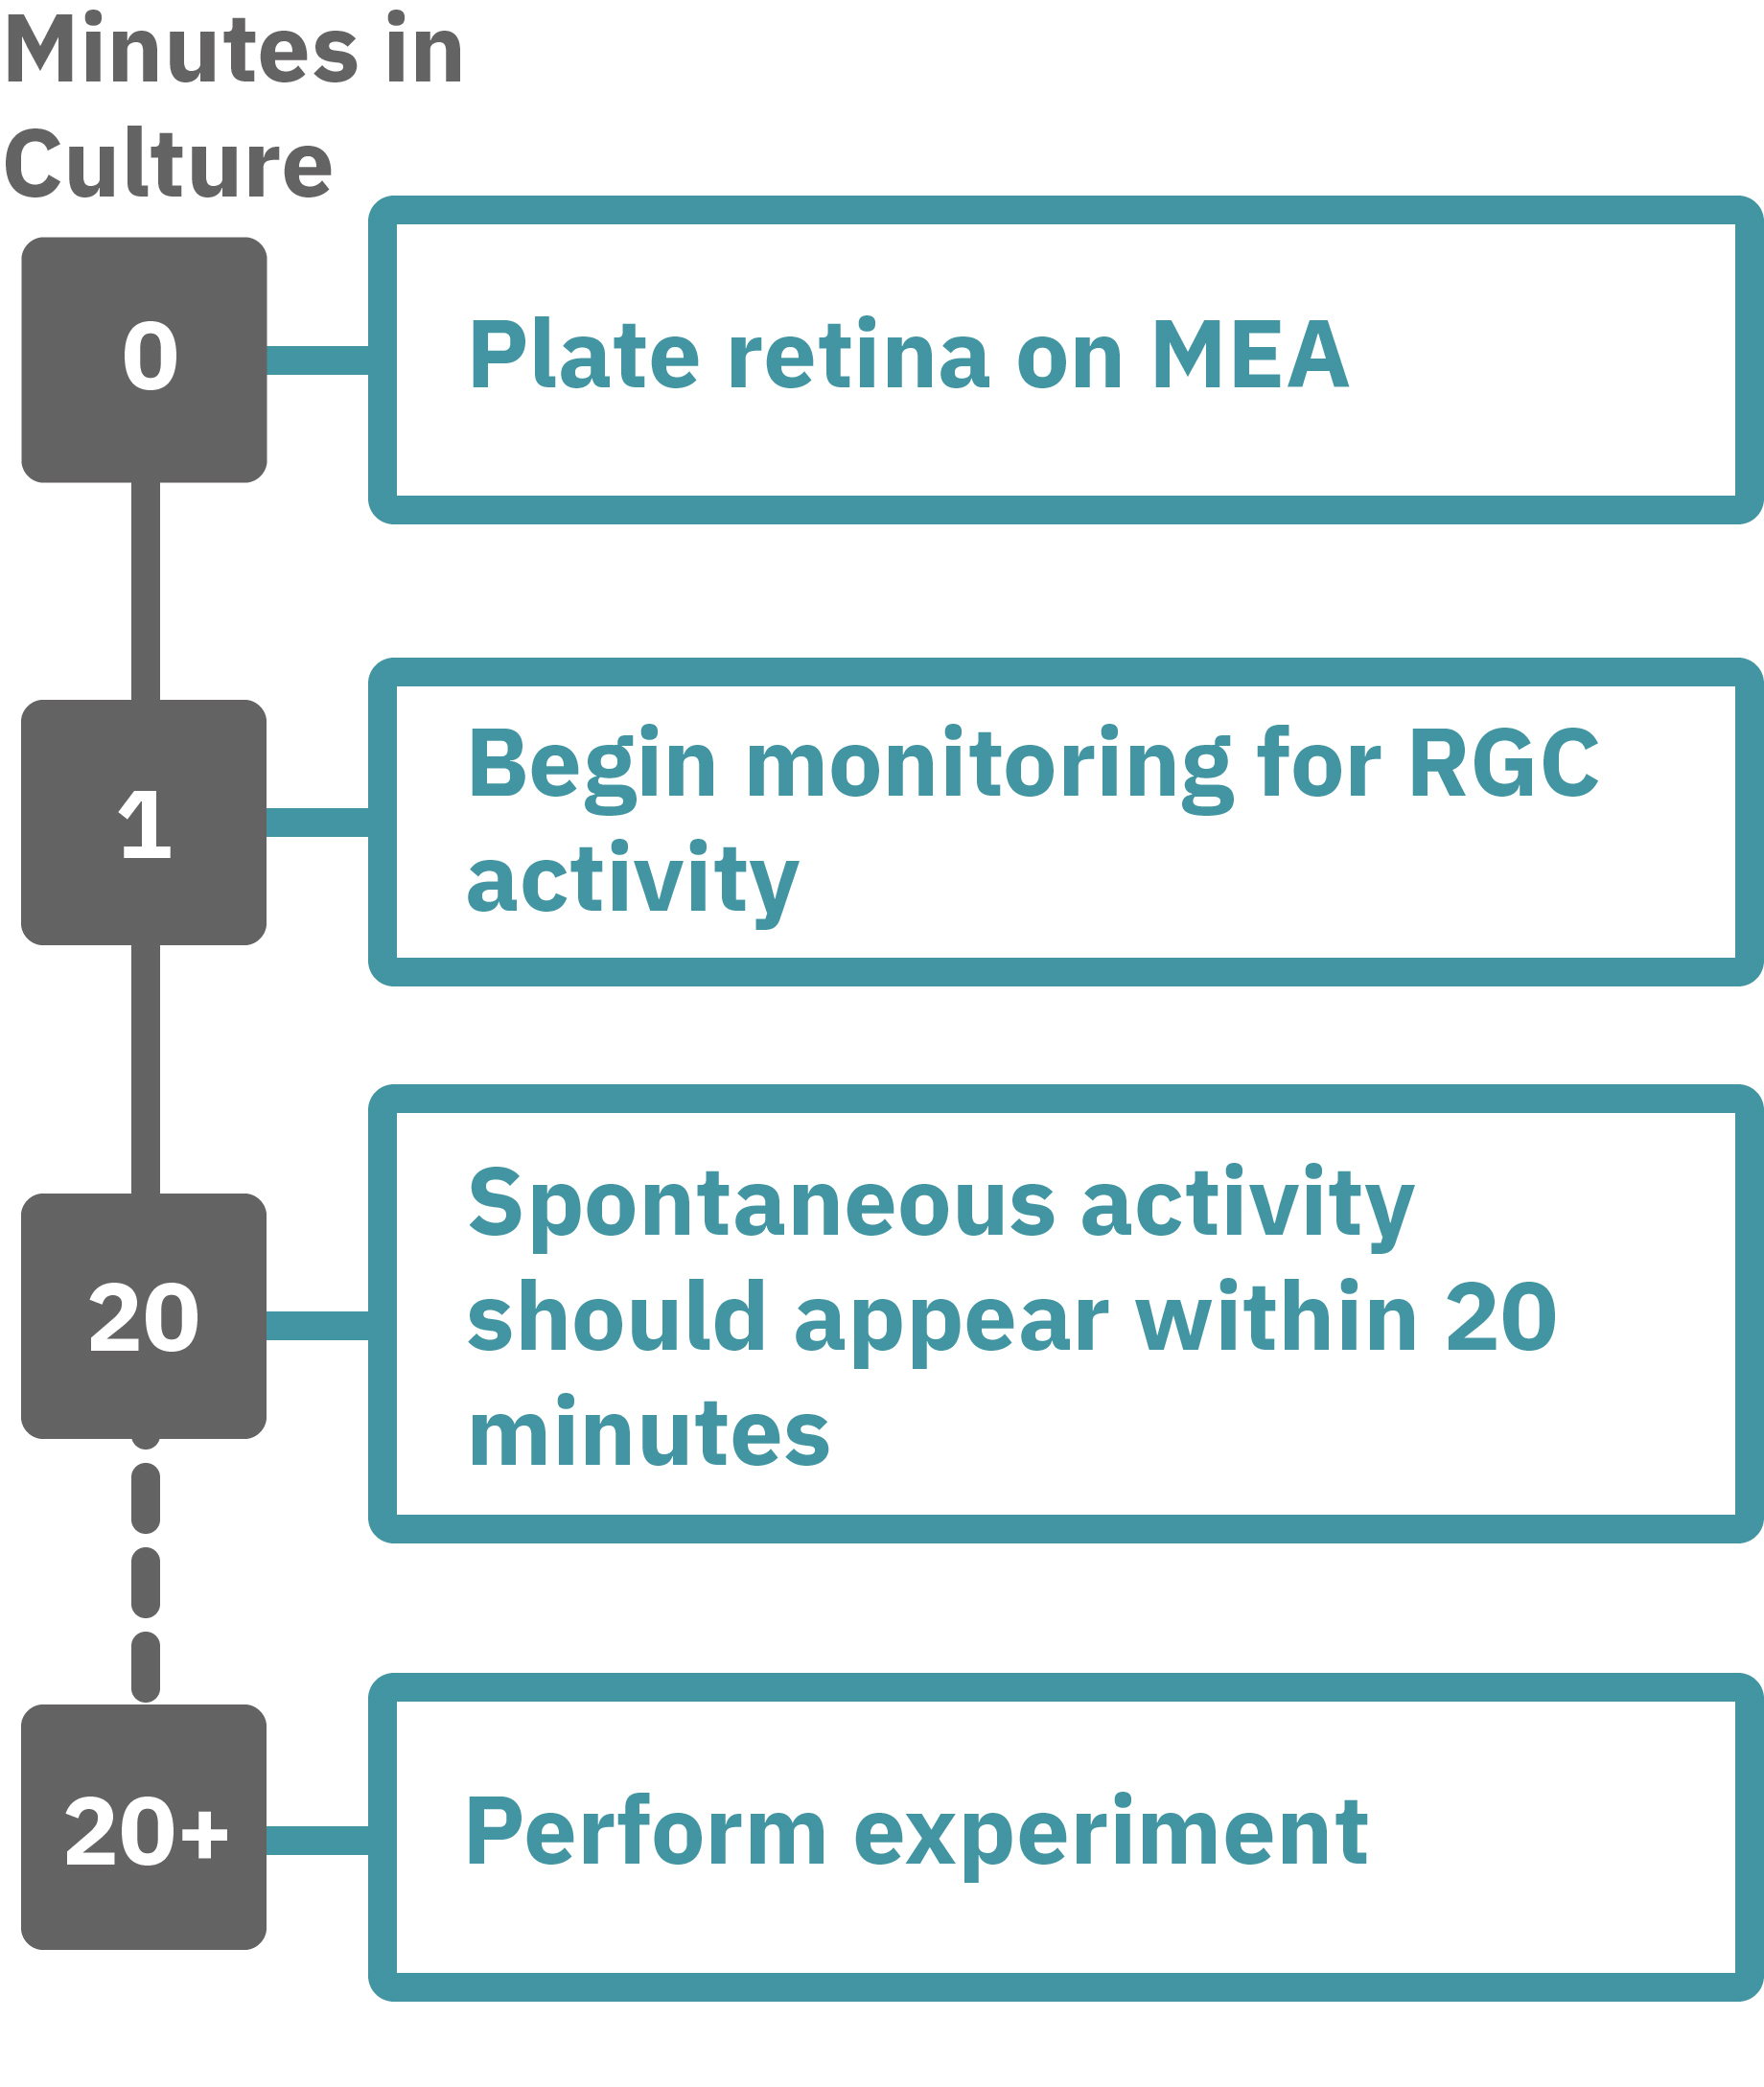
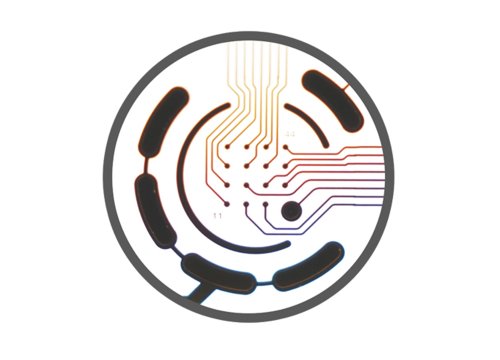
Getting started with Maestro Pro and Edge couldn't be easier. Following euthanasia of a rat, cut out a square piece of retina measuring approximately 2–3 mm on each and place with the ganglion cell side down onto an Axion multiwell MEA plate. Load this MEA plate into the Maestro MEA system and allow the environmental chamber to automatically equilibrate. Measure the neural activity of your retina sample. Add test compounds as required.