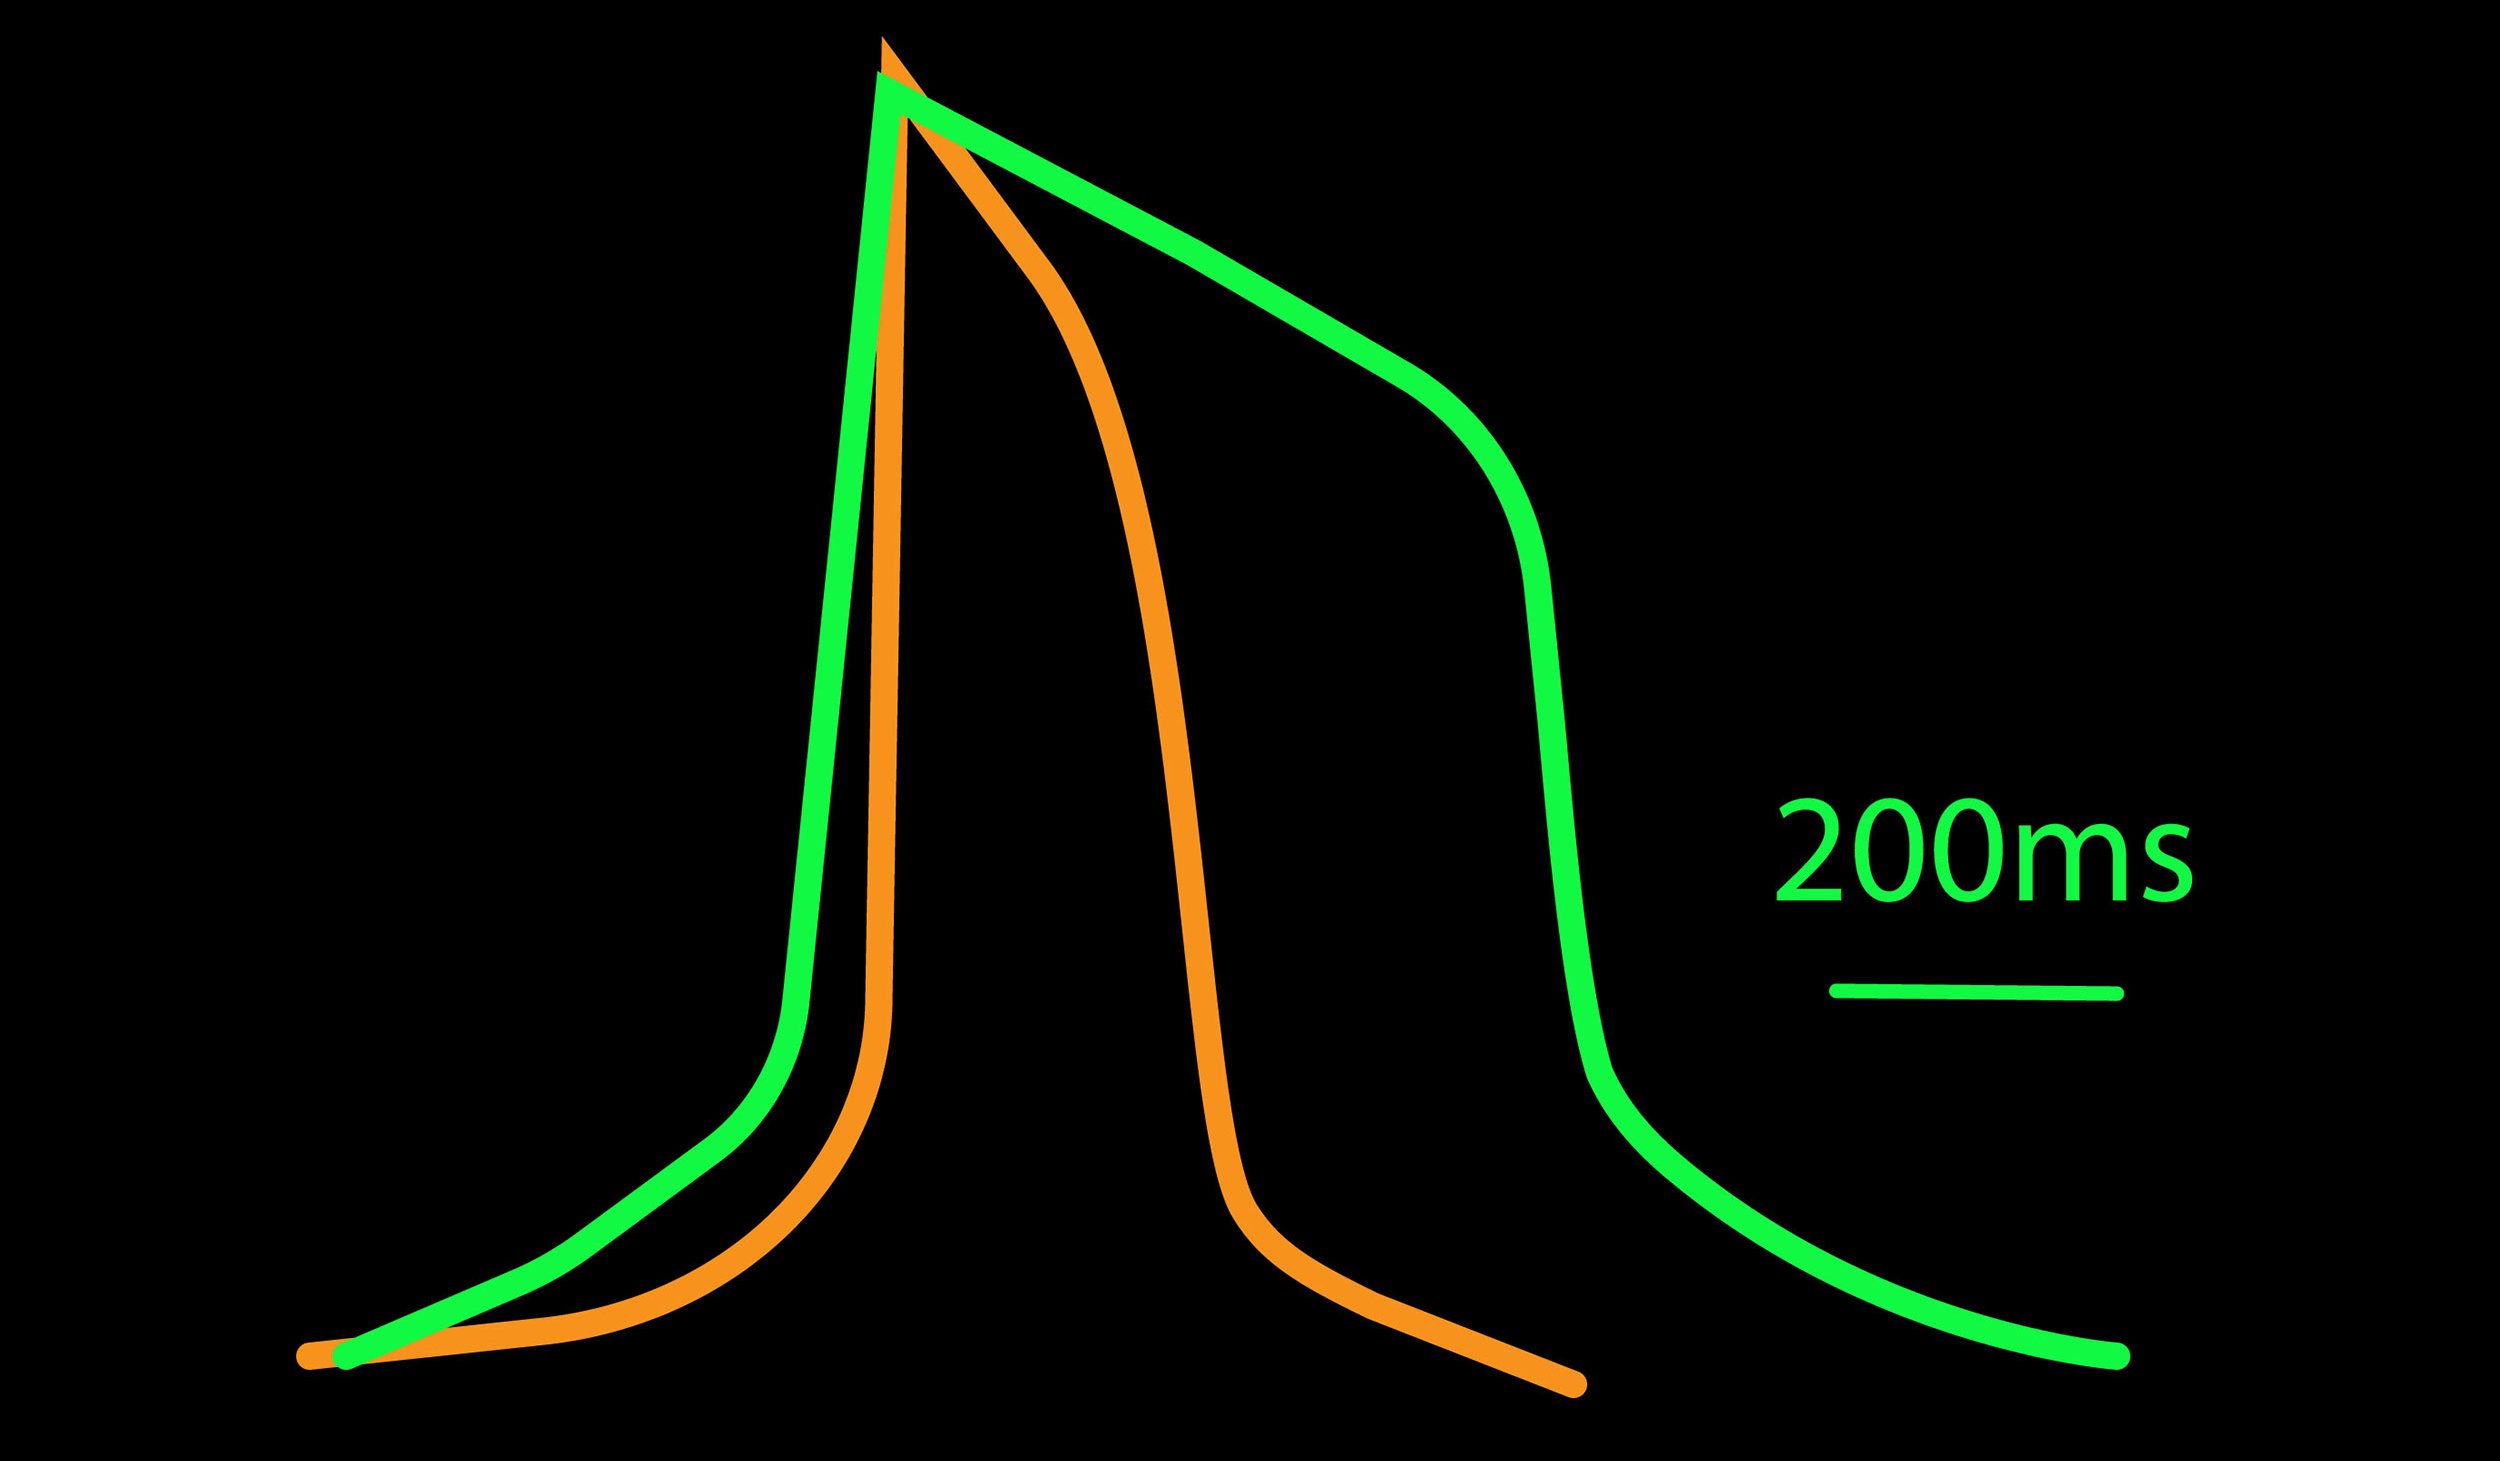
The cardiac action potential can help distinguish the cardiac subtype of a culture. It consists of distinct phases: the depolarization, plateau, and repolarization. The relative duration and kinetics of these phases can help determine if a cell behaves like an atrial, nodal, or ventricular cell. For example, an atrial cardiomyocyte has a minimal plateau phase, a linear repolarization, and a shorter duration, creating a triangular shape. A ventricular cardiomyocyte has a pronounced plateau phase, a longer duration, and takes on a square shape.
The different myocytes in the heart can in part be distinguished based on the shape of their action potential profile. For example, atrial-like cardiomyocytes have a minimal plateau phase and shorter action potential durations (APD90) when compared to ventricular-like cardiomyocytes using LEAP.
The Maestro Pro and Edge MEA systems allow quantification of cardiomyocyte action potential (AP) morphology without the hassle of patch clamp. Measure rise time, action potential duration, beat period, and triangulation from an intact cardiomyocyte syncytium.
The cardiac action potential (AP) is vital for understanding healthy and diseased cardiac biology and drug safety testing. Here, we quantified AP morphology across four human induced pluripotent stem cell-derived lines and primary rodent cardiomyocytes. LEAP can be used to discern subtle differences in AP morphology across cell types and disease models.
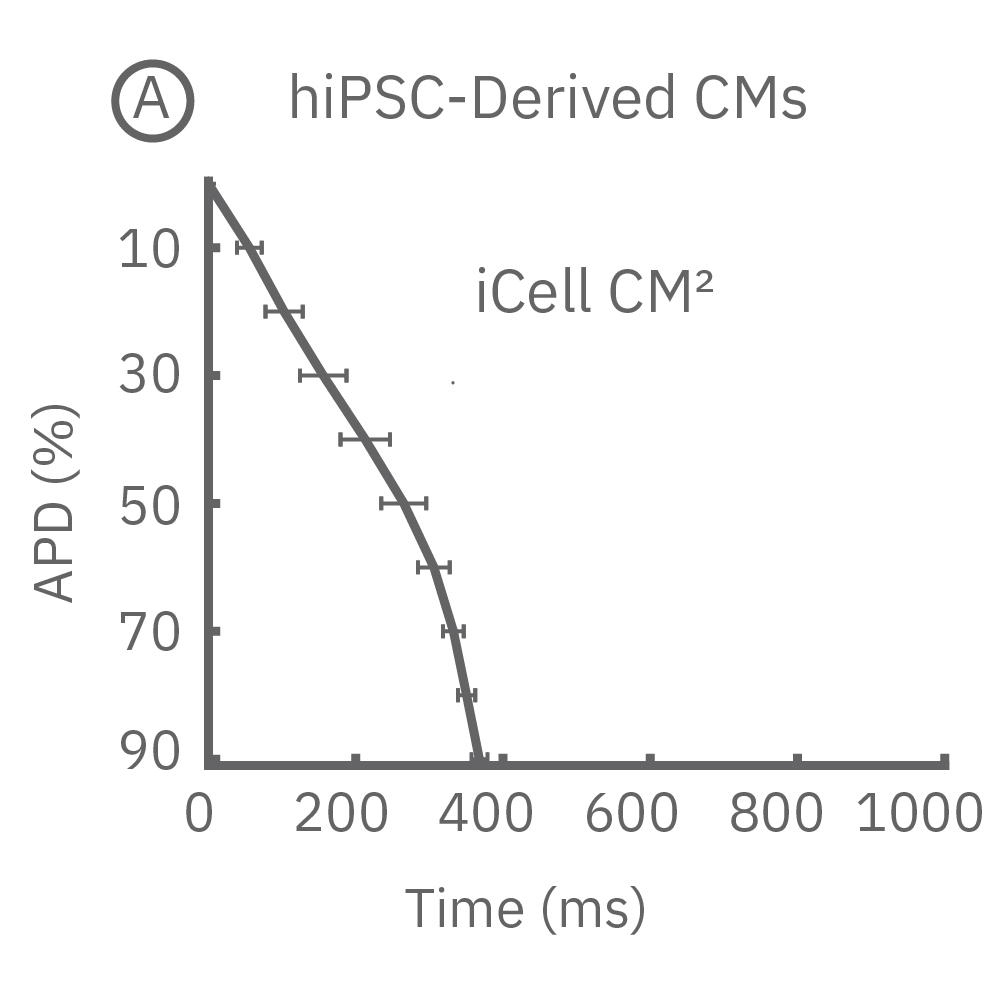
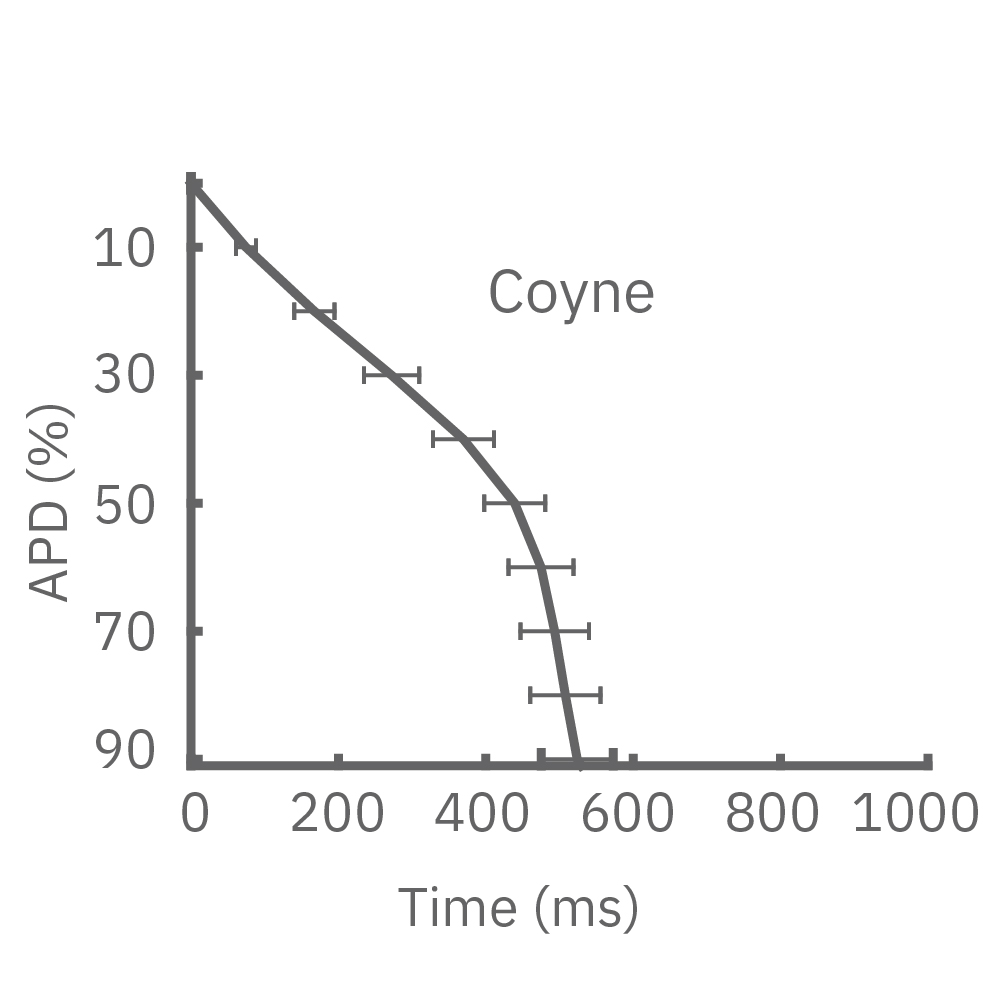
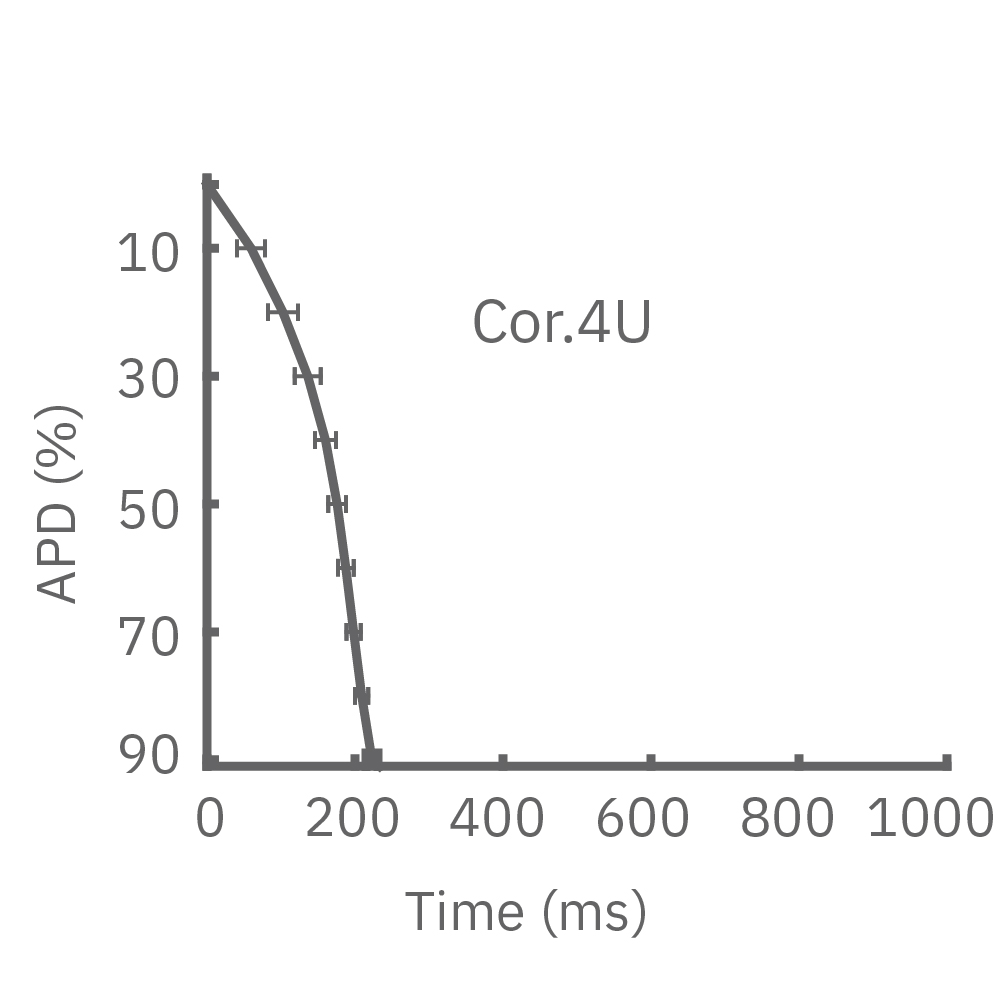
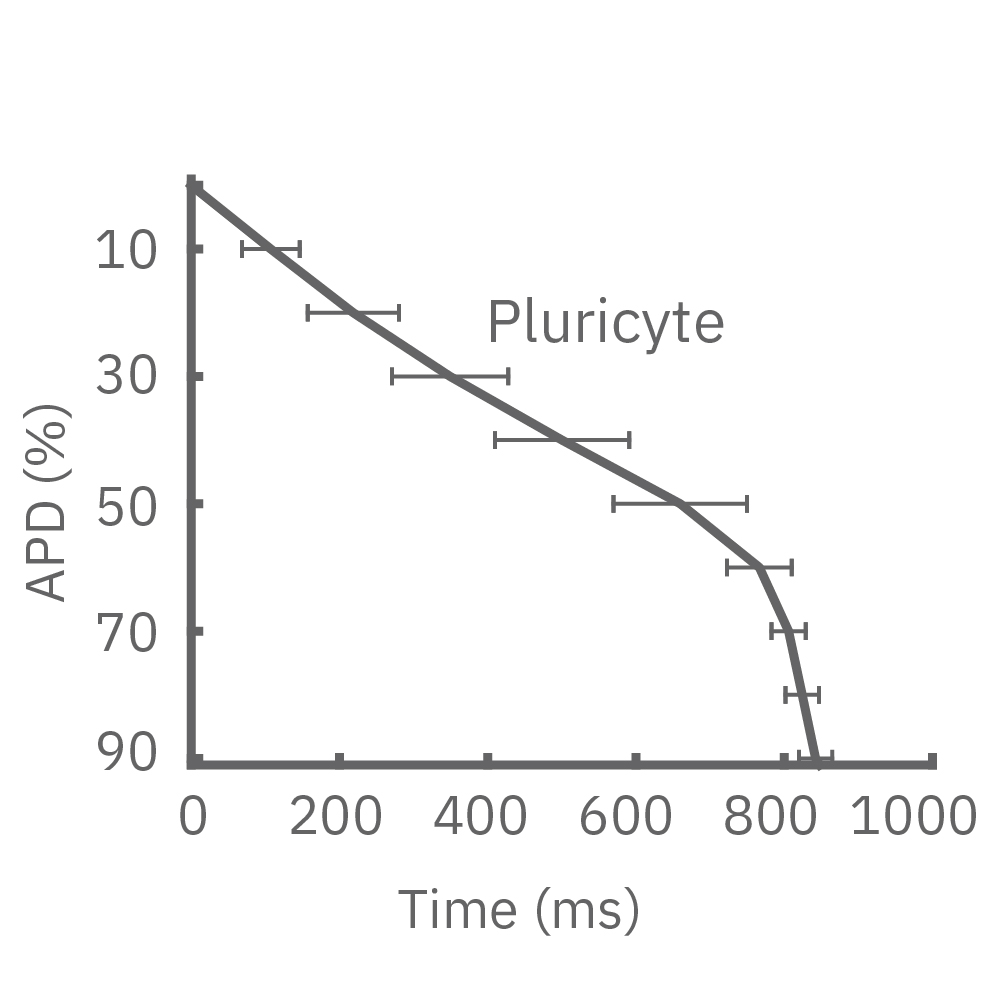
Each panel of the above figure shows the mean and standard deviation of APD from 10 to 90% across replicate wells for each cell type (iCell CM2 n=20 wells, Cor.4U n=17 wells, Coyne n=24 wells, Pluricyte n=5 wells). (A) The cell lines were characterized by different AP morphology, with Cor.4U having the shortest APD and Pluricyte the longest APD. Most cell lines exhibited lower interwell variability for APD during the late rapid repolarization phase, making APD90 a useful marker of repolarization timing. Coyne cardiomyocytes, however, were characterized by less variability during the plateau phase compared to repolarization.
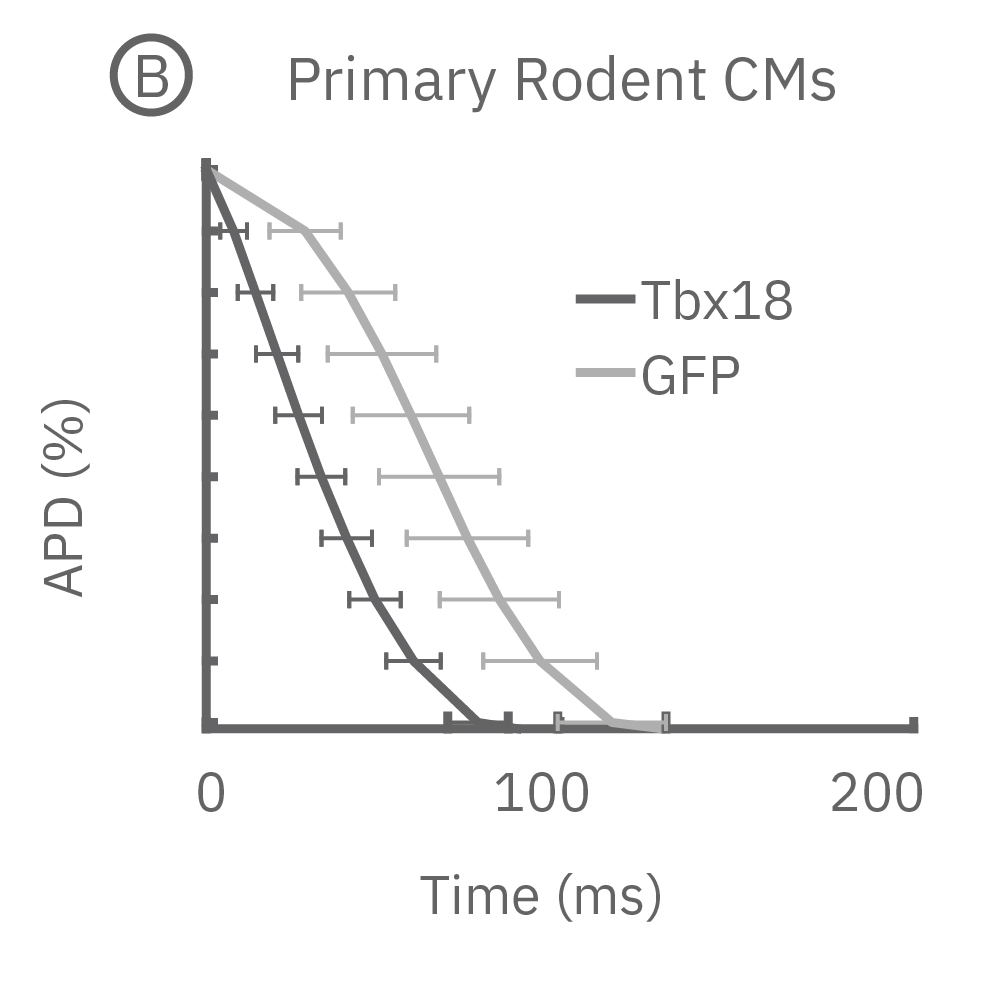
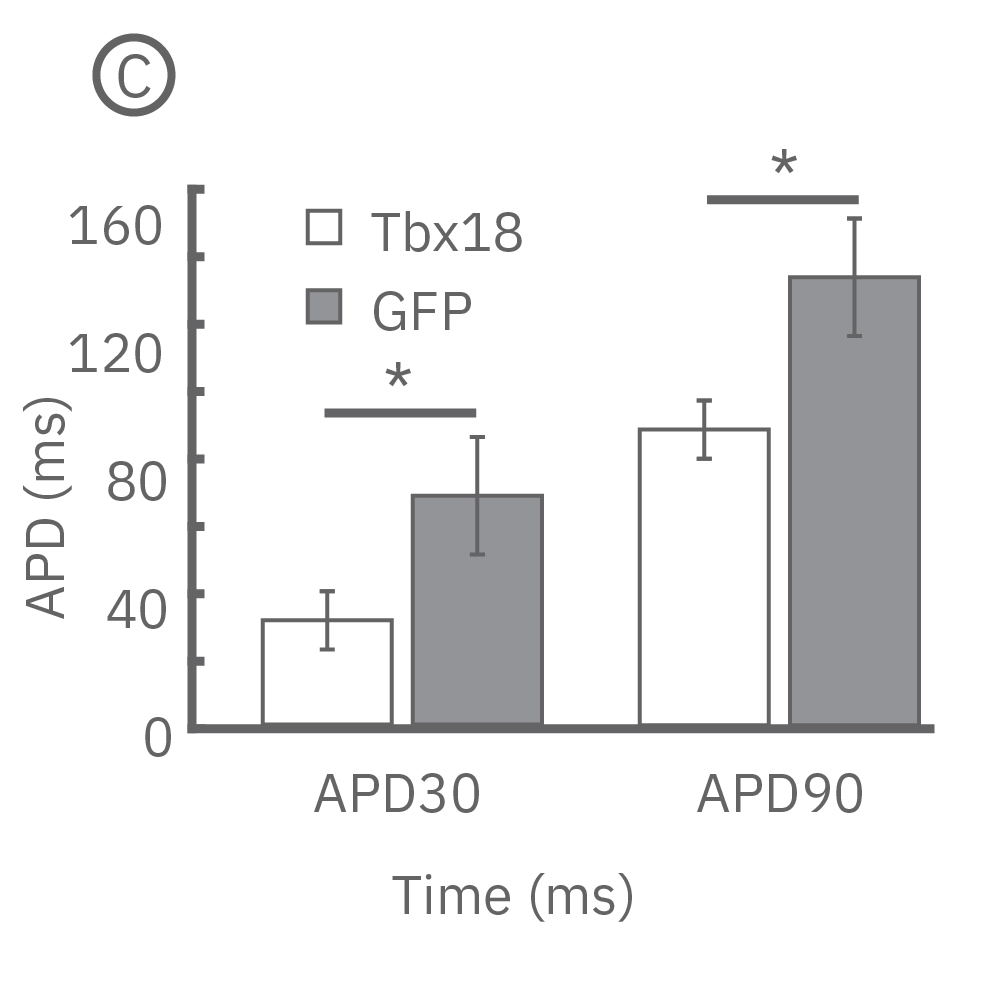
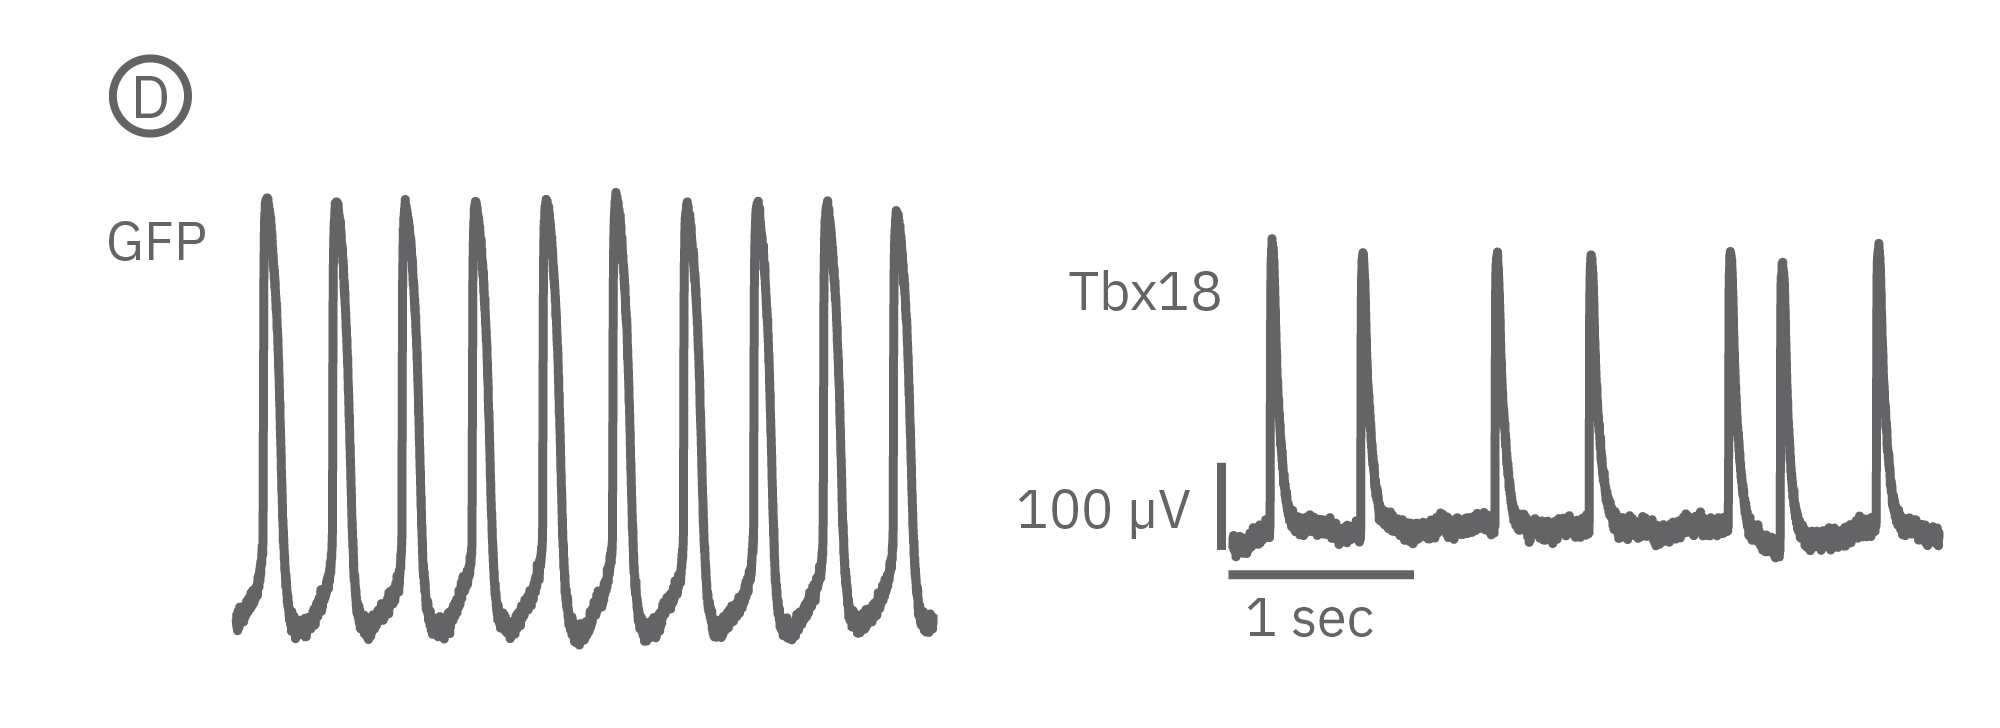
(B) LEAP was measured on primary neonatal rat ventricular myocytes (NRVM) and shown effective for distinguishing changes in AP morphology. Tbx18 is an embryonic transcription factor that has been shown to induce reprogramming of ventricular cardiomyocytes to specialized cardiac pacemaker cells. (C) As anticipated from a nodal-like AP, Tbx18-transduced NVRMs exhibited a shortened APD30 and APD90 compared to GFP controls. (D) In addition, beat period coefficient of variation was significantly higher for Tbx-transfuced NVRMs compared to GFP-transduced.
These differences may reflect the relative immaturity of the hiPSC-CM phenotype, as fetal cardiomyocytes exhibit an innate automaticity that is absent in adult cardiomyocytes. The variable beat rate across cell types highlights the value of controlling beat rate for quantification of AP morphology across distinct cell populations.
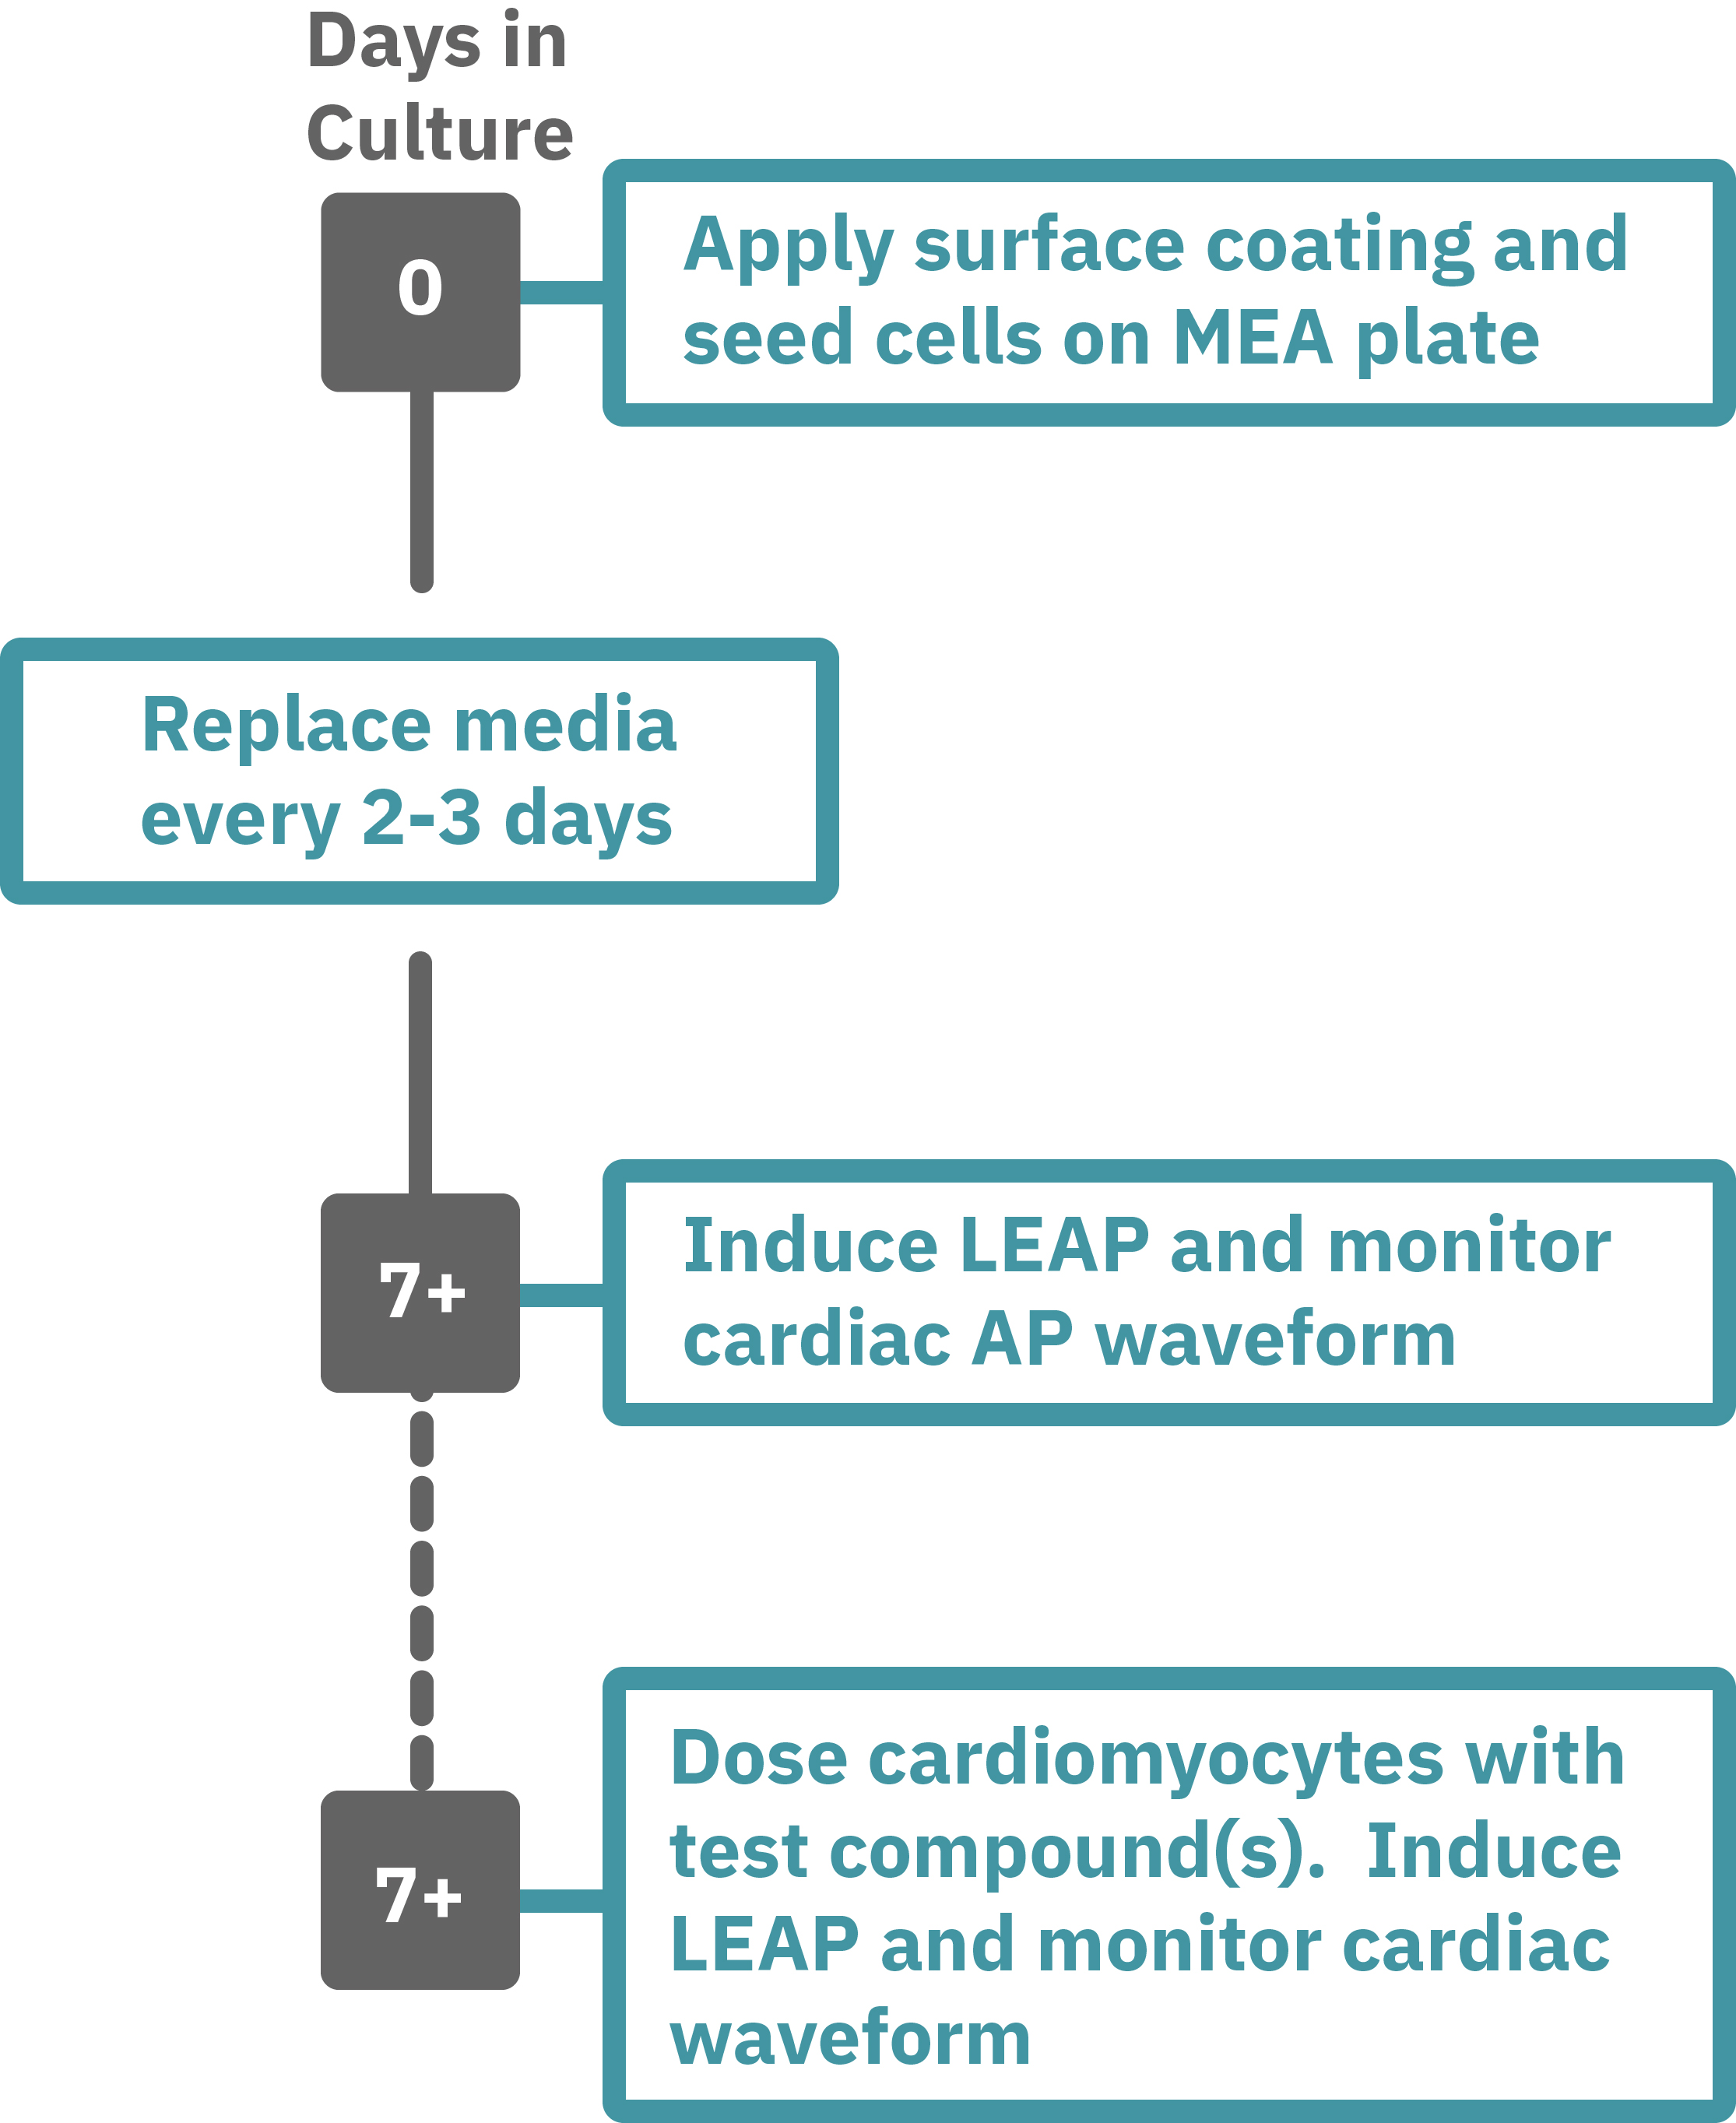
Getting started with Maestro Pro and Edge couldn't be easier. Culture your cells in an Axion multiwell MEA plate (Day 0). Load the MEA plate into the Maestro MEA system at the desired recording times and begin recording. Induce LEAP and monitor the cardiomyocyte activity in the MEA plate label free and in real time with AxIS Navigator Cardiac Module software (e.g. Day 7). Add test compounds as required and induce LEAP to record the cardiomyocyte AP waveform.