Abstract
In vitro scratch assays can be used to assess cancer cell migration and the effect of potential therapeutics on migration, a key factor in metastatic potential. In this study, the Maestro Z impedance assay was used to characterize the migration of two breast cancer cell lines: MCF-7, a hormone-receptor positive line, and HCC1806, a triple-negative breast cancer line. Migration represents a key factor in the metastatic cascade and a proxy for metastatic potential. Each cell type exhibited a unique impedance profile over time during proliferation, and showed consistent decreases in impedance as a result of the scratch. Triple negative cells HCC1806 migrated to almost fully cover the gap, whereas MCF-7 cells migrated very little over the course of 72 hours. Furthermore, the addition of modified citrus pectin (MCP), a polysaccharide that shows promising effects for reducing metastasis, slowed migration into the gap in both cell types.
Keywords: Scratch assay
Introduction
Triple-negative breast cancer (TNBC) is an aggressive type of cancer that has a poorer prognosis than other types of breast cancer due to limited therapeutic options and a high risk of metastatic reoccurrence. A cell migration/wound healing assay can be used to assess metastatic potential of cancer cells and evaluate potential antimetastatic therapies. One naturally-occurring substance shown to have antimetastatic properties for several cancers, including breast cancer, is modified citrus pectin (MCP).1,2,3 MCP is a modified polysaccharide derived from the peel of citrus fruit. It has shown promising results for reducing metastasis by blocking the galectin-3 pathway, which is believed to protect cancers during “loss of anchorage” phase of metastasis (anoikis).1
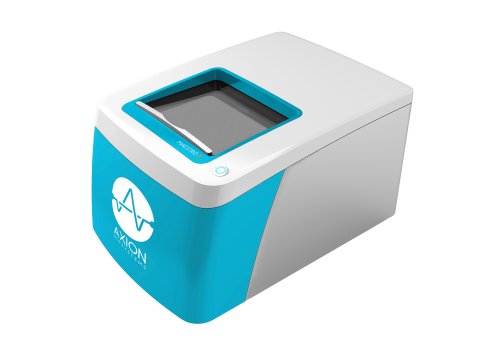
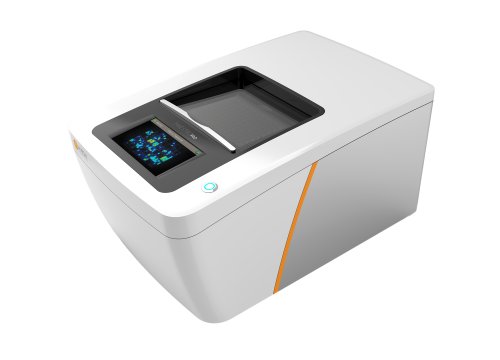
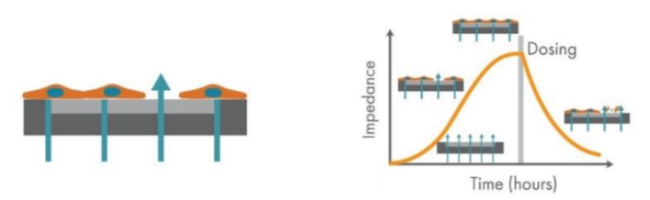
Assessing the metastatic potential of cancer cells in vitro is often done via imaging assays, which are subjective and often limited to snapshots in time.4 Axion BioSystems’ Maestro Z platform offers impedance-based cell analysis for real-time, label free monitoring of cells (Figure 1). The Maestro Z impedance assay is a sensitive and nondestructive method to continuously monitor cancer cells, allowing assessment of both the kinetics and degree of migration after scratch, providing a powerful quantification of key factors in metastatic potential. Here we used the Maestro Z to characterize the spread, adhesion, and growth of two human cancer cells lines, including HCC1806 TNBC cell type, and compared the cells’ migration into a scratch-induced gap in the monolayer. Also, changes in cell migration in response to treatment with MCP were examined.
Materials and Methods
Materials
Cells
Breast cancer cells were obtained from ATCC (Manassas, VA). MCF-7 (Cat. HTB-22) and HCC1806 (Cat. CRL-2335) cells were used in the experiment.
Experimental components
Poly-D-lysine, or PDL, (Cat. P6407-5MG), Tamoxifen (Cat. T5648-1G), and Pectin (Cat. P9135-100G) were purchased from Sigma Aldrich (St. Louis, MO). PectaSol-C was purchased from ecoNugenics (Santa Rosa, CA). PDL was dissolved in 50 mL sterile DI water to obtain a 0.1 mg/mL PDL solution that was used to coat the CytoView-Z plate. Modified citrus pectin (MCP) was prepared in-house by modifying pectin with heat. DMEM complete media was comprised of DMEM (Invitrogen, Cat. 11885-084), 10% FBS (Atlanta Biologicals, Cat. S11150), and 1% penicillin-streptomycin (Invitrogen, Cat. 15140-122). Low serum media was comprised of DMEM, 2% FBS, and 1% penicillin-streptomycin.
CytoView-Z 96 plate
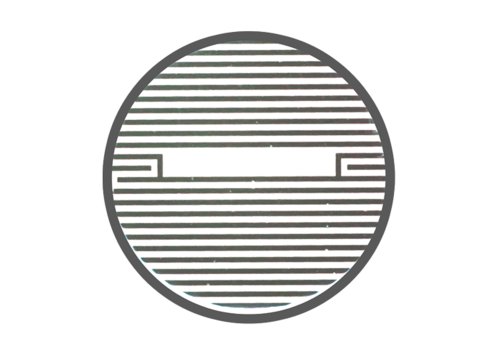
A CytoView-Z 96-well plate (Axion BioSystems) was used for the experiment. The plate is composed of a polyethylene terephthalate (PET) surface with a gold recording electrode embedded in the culture surface of each well. Humidity reservoirs on the plate were filled with sterile deionized water to maintain humidity.
Maestro Z Impedance-based assay platform
The Maestro Z platform (Axion Biosystems) uses impedance measurements (ohms, Ω) to quantify the presence of cells on the electrode. To measure impedance, small electrical signals are delivered to the electrodes. Cell attachment, spreading, and cell cell connections block these electrical signals and are detected as an increase in impedance. Impedance is also sensitive to subtle changes in cell conformation, such as those caused by receptor mediated signaling or cell morphology. Since impedance is noninvasive and label-free, impedance assays can be used to quantify dynamic cellular responses over minutes, hours, and days. In addition, the Maestro Z has built-in environmental control, finely controlling temperature and CO2 throughout the experiment.
Methods
Plate preparation
To coat the surface of the plate, 50 µL of 0.1 mg/mL PDL was added to each well. After 30 minutes at room temperature, the surface coating was aspirated and 100 µL of DMEM complete medium was added to each well.
Media-only recording
The plate was docked in the Maestro Z and a media-only reference was recorded to provide a baseline for the data collected during the rest of the experiment.
Cell culture
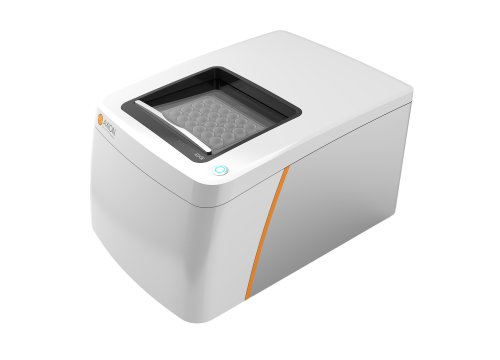
MCF-7 and HCC1806 cells were thawed and cultured in accordance with supplier recommendations. Trypsin-EDTA (0.05%) was used to detach and collect cells from the flasks. A sample of the cell suspension was used to count total number of viable cells using Trypan blue solution. The cell suspension was transferred to a 50 mL conical tube and was pelleted by centrifugation. The supernatant was aspirated, and the cell suspension was diluted in DMEM complete medium to final working concentrations of 27,000 cells/100 µL for MCF-7 and 30,000 cells/100 µL for HCC1806. Cells were seeded into the CytoView-Z plate at 100 µL per well (Figure 2). After seeding the cells, another 100 µL fresh medium was added to each well, bringing the total well volume to 200 µL per well. Twenty-eight w ells were plated for each of the cell types. Five additional wells were plated with MCF-7 cells for treatment with Tamoxifen as a control. Seven wells were filled with DMEM complete media to serve as media reference wells. Sterile DI water (6 mL) was added to the humidity reservoirs on the edges of the plate. After cell addition, the plate was left to rest in the biosafety cabinet for one hour at room temperature.
Impedance recordings
The plate was docked in the Maestro Z and the automatic environment controls set the chamber to 37°C and 5% CO2. Impedance measurements were recorded every minute for the first 3 days. After 72 hours, cells were switched into low-serum media, and the impedance was monitored for another 24 hours prior to the scratch assay and treatment. Low-serum media was used to transition the cells into a reduced proliferative state, in order to isolate changes in impedance due to migration of the cells.
Scratch Assay and Treatment
To assess migration of each of these cell lines, 100 µL pipette tips were used to scratch away cells in the center of each well (n= 20 wells per cell type), creating a gap in the monolayer approximately 0.8 mm wide. Care was taken to not scratch the electrode in the bottom of each well. Immediately after the scratch, PectaSol-C and in-house MCP were each added to 5 wells per cell type to examine potential effects on cell migration into the gap.
Results
Different impedance profiles for each cell line
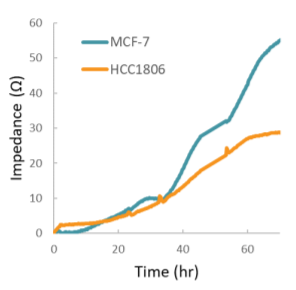
Impedance was tracked continuously for MCF-7 and HCC1806 cells using the Maestro Z system (Figure 3). Each of the cell types exhibited a unique impedance profile over time. Both MCF-7 and HCC1806 initially attached and spread, resulting in a steady increase in impedance. HCC1806 reached confluency by 60 hours, while MCF-7 continued to proliferate for a higher maximum impedance.
Monitoring cell migration using impedance
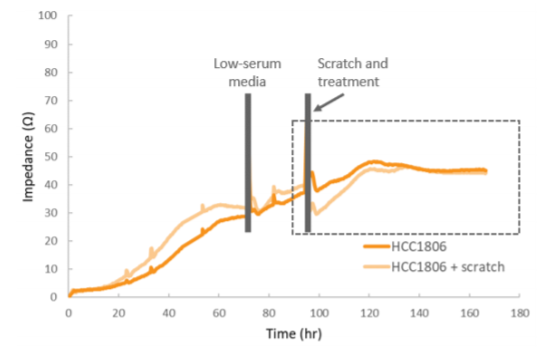
After 72 hours, cells were switched into low-serum media, and the impedance was monitored for another 24 hours prior to the scratch and treatment with MCP (Figure 4). The raw impedance data was normalized to the impedance just prior to the scratch in each well, and then corrected for the untreated, unscratched wells. This correction accounts for ongoing proliferation in order to isolate migration effects. Future experiments could include an antimitotic agent to prevent proliferation. Subsequent figures show the normalized impedance in the post-scratch time window (indicated by the dotted line).
Post-scratch impedance is uniform across wells
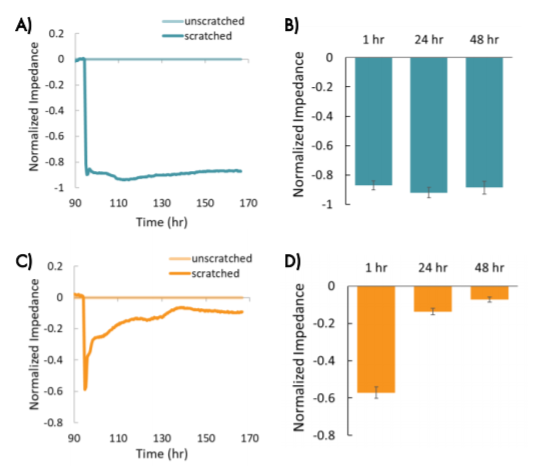
The decrease in impedance following the scratch was consistent across wells for each cell type, indicating that the scratches were uniform and consistently applied. Both cell types showed a large, consistent decrease initially (~1 hour) in impedance in wells that were scratched relative to wells that were unscratched (Figure 5).
Five additional MCF-7 wells were dosed with Tamoxifen and showed a complete reduction in impedance due to cell death (data not shown).
Breast cancer migration into the gap
The two breast cancer lines showed different changes in impedance in response to the scratch and treatments over time, suggesting differences in migration that reflect metastatic potential. MCF-7 cells showed a large decrease in normalized impedance as the result of the scratch (> 0.8), and normalized impedance remained decreased over time, suggesting the cells were not migrating into the scratch (Figure 5, A and B).
Conversely, HCC1806 cells, a triple negative cell type with high metastatic potential, showed an initial decrease in impedance relative to the unscratched wells, but a subsequent increase in impedance over time, suggesting the cells were migrating into the scratch and covering the electrode. The impedance in the scratched wells had increased to nearly match the unscratched wells by 48 hours after the scratch (Figure 5, C and D, normalized impedance < 0.1).
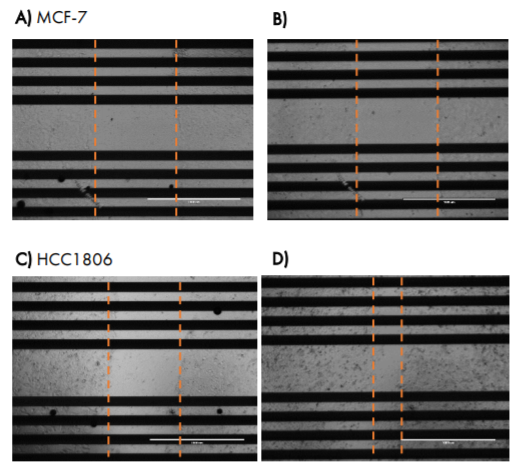
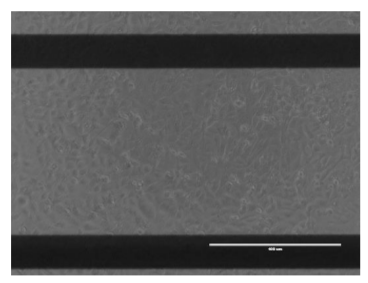
Images taken at 24 hours post-scratch confirm that triple negative cells HCC1806 were migrating into the gap, whereas MCF-7 cells were not (Figure 6).
MCP slows migration into the gap
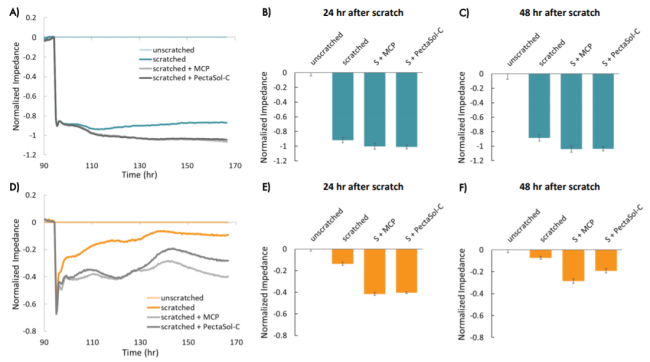
In both cell types, the addition of modified citrus pectin (MCP) resulted in a lower impedance over time following the scratch, as compared to untreated wells, suggesting that MCP reduced migration in these cells (Figure 7). HCC1806 cells treated with PectaSol-C MCP showed higher impedance than cells treated with in-house MCP after approximately 35 hours, suggesting cells treated with PectaSol-C MCP may have migrated more than those treated with in-house MCP. In both cases, the impedance suggests that MCP-treated cells migrated less than untreated cells.
Conclusion
The Maestro Z platform enables simple, label-free, non-invasive monitoring of cellular proliferation and migration. Here we showed that the Maestro Z impedance assay readily distinguishes the profiles of different breast cancer cell lines. Furthermore, the assay can quantify changes in impedance after cells are scratched off the electrode, and sensitively detect differences in migration to fill in the gap, a key factor in metastatic potential. As shown here, the assay is sensitive to differing rates of migration depending on cell type and treatments applied.
References
1. GlinskyVV and Raz A, 2009, Carbohydr Res 344(14): 1788– 1791.
2. Nangia-Makker P et al, 2002, J Natl. Cancer Inst. 94(24):1854–1862.
3. Sathisha UV et al, 2007, Glycoconj J. 24(8):497–507.
4. Pouliot N, Pearson HB, and Burrows A. Investigating Metastasis Using In Vitro Platforms. In: Madame Curie Bioscience Database [Internet]. Austin (TX): Landes Bioscience; 2000-2013.