Key Findings
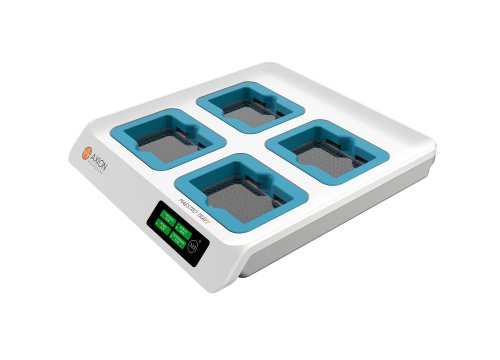
>> Axion BioSystems’ Maestro TrayZ is a high-throughput platform featuring a slim multi-plate tray design compatible with any standard incubator.
>> Maestro TrayZ cell-based assays demonstrate low plate-to-plate variability.
Abstract
High-throughput assays play a critical role in the discovery of new technologies and are often used to screen large numbers of treatment groups, particularly in drug development, genetic screening, and toxicity testing. The Maestro TrayZ live-cell analyzer is an impedance-based system that continuously monitors cell behavior from four 96-well CytoView-Z plates inside a standard incubator. This technical note presents several case studies to illustrate how Maestro TrayZ can be used to validate and test different high-throughput assays.
Introduction
High-throughput screening (HTS) assays are invaluable tools in the therapeutic drug development pipeline. Specifically, in vitro assays that primarily use human cells are essential for the discovery of potential new bioactive agents. The ability to rapidly screen and select from a large collection of compounds, genes, or other agents that perturb normal cellular processes is key in focusing future efforts on the appropriate targets. For example, HTS is most commonly used in the pharmaceutical industry to help guide product development and regulatory decisions earlier in the drug discovery phase.
The Maestro TrayZ is a flexible, high-throughput live-cell analysis platform. Using label-free bioelectronic assay technology, the Maestro TrayZ allows for continuous monitoring of up to four CytoView-Z 96-well plates simultaneously. Users can choose to measure multiple biological or technical plate replicates in parallel or perform four separate experiments.
Here, we present a series of case studies demonstrating how the Maestro TrayZ can be used to develop and perform in vitro impedance-based HTS assays. The % coefficient of variation (% CV), a statistical measure that describes the precision and repeatability of an assay, was calculated to assess the plate-to-plate variability of the TrayZ platform. A % CV less than 20% is recommended when comparing assay plate replicates (Iversen et al, 2012). The data presented here illustrates that Maestro TrayZ is capable of accurately measuring and quantifying cell behaviors, such as cell proliferation, formation of cell-cell connections, and cell death in response to compound or immune cell addition with minimal variation between plate replicates.
Materials and Methods
Cell culture and drug treatment
SKOV3 (Cat. HTB-77), A549 (Cat. CCL-185), and Calu-3 cells (Cat. HTB-55) were obtained from ATCC (Manassas, VA). SKOV3 media was composed of McCoy's 5A Medium Modified (ATCC, Cat. 30-2007), 10% FBS (Gibco, Cat. 16000044), and 1% penicillin/streptomycin (Gibco, Cat. 15140122). A549 media was composed of F12-K media (Gibco, Cat. 1127022), 10% FBS (Gibco, Cat. 16000044), and 1% penicillin/streptomycin (Gibco, Cat. 15140122). Calu-3 media was composed of Minimum Essential media (Gibco, Cat. 11095080), 10% FBS (Gibco, Cat. 16000044), and 1% penicillin/streptomycin (Gibco, Cat. 15140122).
CAR T cells targeting HER2 (HER2 scFv-4-1BB-CD3ζ, Cat. PM-CAR1070-1M) and CAR T cell media (Cat. PMCAR2001) were obtained from ProMAB Biotechnologies (Richmond, CA). Paclitaxel (Cat. 10461) and doxorubicin (Cat. 15007) were purchased from Cayman Chemicals (Ann Arbor, MI)
Maestro TrayZ platform
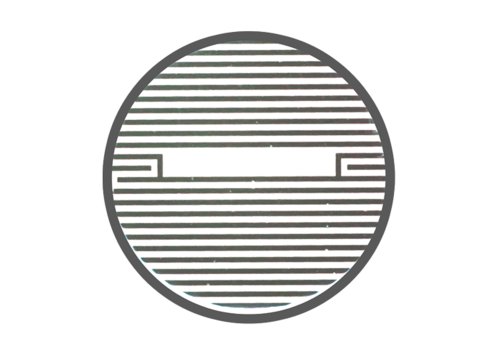
The Maestro TrayZ platform uses impedance measurements (ohms, Ω) to quantify the presence of cells on electrodes embedded in the bottoms of the wells of up to four CytoView-Z 96-well plates. Cellular impedance is a well-established technique for measuring cell attachment, spreading, proliferation, coupling, membrane integrity (cell death), and subtle changes in cell conformation. Detection is noninvasive and label-free, so it can quantify dynamic cellular responses over minutes, hours, and days. The Maestro TrayZ is placed inside a cell culture incubator to provide appropriate temperature and CO2 for cell culture.
Cell plating
CytoView-Z 96-well plates (Axion BioSystems) were coated with 100 µL of fibronectin solution (1µg/mL) per well and incubated at 37°C and 5% CO2 for at least one hour. After incubation, excess surface coating was aspirated from each well. Then 100 µL of cell culture medium was added per well and docked on the Maestro TrayZ platform to record a media reference. Plates were rested at room temperature for 15 minutes prior to cell seeding.
SKOV3, A549, and Calu-3 cells were thawed and cultured in their respective media according to the supplier recommendations, passaging as needed. Cells were lifted from flasks and dissociated via trypsinization. The cell suspension was then transferred to a 15 mL conical tube and centrifuged at 1,000 rpm for five minutes. The supernatant was aspirated, being careful to not disturb the cell pellet. Cell density and viability were determined using a hemocytometer. Cells were resuspended and diluted in appropriate media to the desired cell number per 100 µL. After cell addition (100 µL per well) to CytoView-Z 96-well plates, the plate was allowed to rest at room temperature for one hour prior to docking on the Maestro TrayZ.
Calculation of endpoints
The % coefficient of variation (% CV) for each treatment condition was calculated as
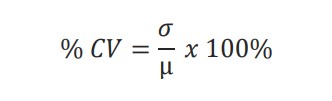
where µ and σ represent the mean and standard deviation. The calculated % CVs should be 20% or less to demonstrate minimal variability.
The dose response analysis module in AxIS Z allows the user to perform a best fit regression using a linear model or a Hill equation model. The Hill equation is a 4- parameter logistic model:
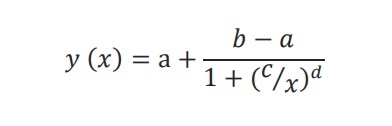
The lower (a) and upper (b) asymptotes define the minimum and maximum value of the best fit line. The dose at half-maximal response (c) is often referred to as the EC50 or IC50 and the Hill slope (d) gives the slope at the steepest part of the curve.
%Cytolysis was used to quantify cell death and was calculated using the following equation:
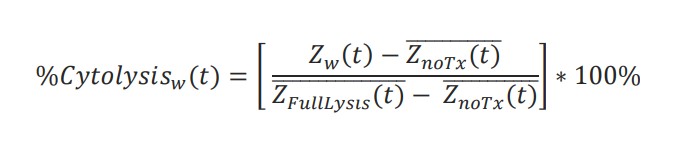
where 𝑍𝑛𝑜𝑇𝑥(𝑡̅) is a time series and the mean of the no treatment control wells and 𝑍𝐹𝑢𝑙𝑙𝐿𝑦𝑠𝑖𝑠(𝑡) is a time series and the mean of the full lysis control wells. %Cytolysis and kill time 50 (KT50) were calculated and exported using AxIS Z software.
GraphPad Prism software was used to perform a twoway ANOVA analysis which divides the total variability into four components: (1) interactions between treatment groups and plates, (2) variability among treatment groups, (3) variability among plates, and (4) residual error. Residual error describes the variation among replicates not related to systematic differences between treatment groups and plates.
Results
Case study: Density sweep assay
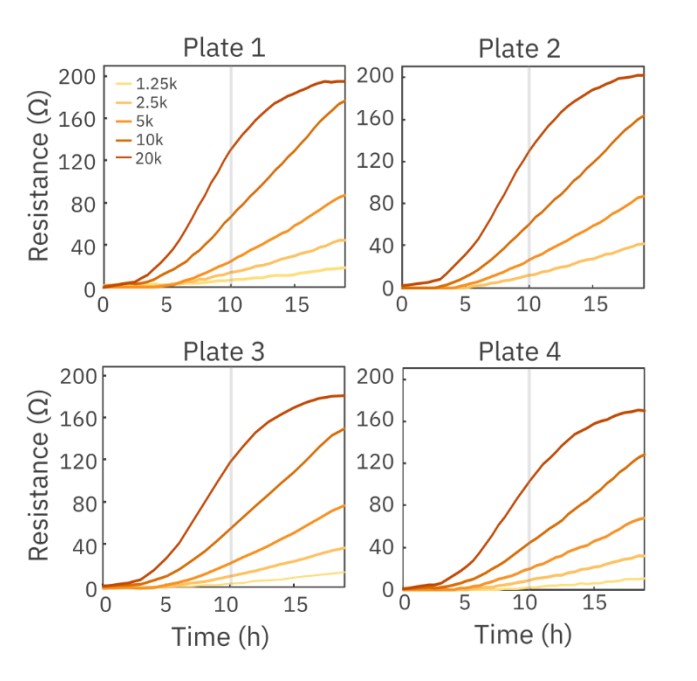
Cell density sweeps are often performed before beginning a cytotoxicity assay to determine optimal plating density and to optimize assay timing. Here, A549 cells were seeded at 1,250, 2,500, 5,000, 10,000 and 20,000 cells per well across four different plates and their impedance was tracked by Maestro TrayZ for 20 hours. The highest density of A549 cells (20,000 cells per well) reached confluence near 17 hours, exhibited by the plateau in resistance. At 10 hours, a linear regression curve was fit to calculate the relationship between resistance and cell number during the logarithmic growth phase of the A549 cells. The slopes for plates 1, 2, 3, and 4 were 6.66, 6.74, 6.20, and 5.40 ohms/1k cells, respectively, with an overall standard deviation of 0.61 and an overall CV of 9.82% across plates.
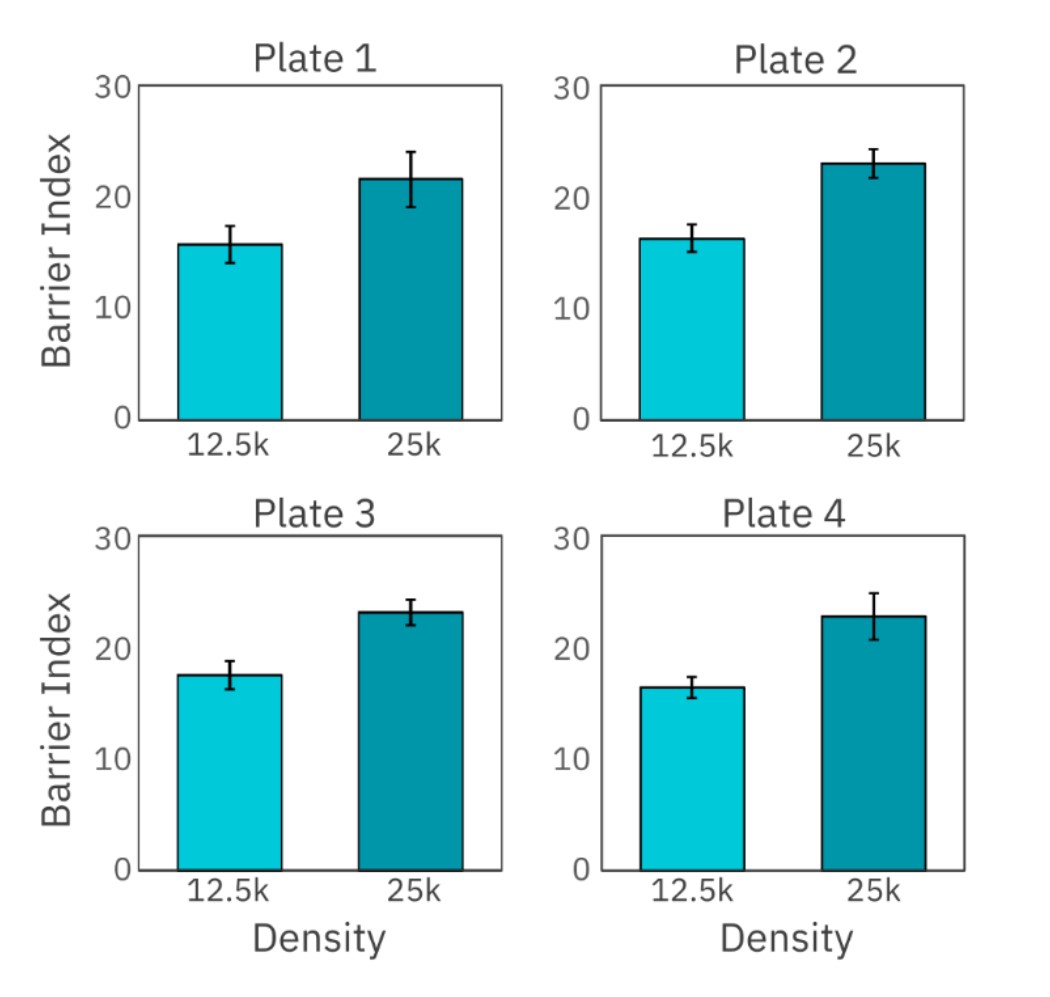
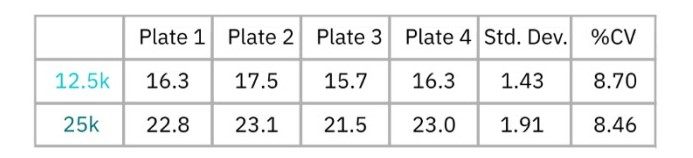
Maestro TrayZ can also measure differences in the strength of cell-cell connections formed by cells, like Calu-3 cells which produce tight junctions. Here, Calu-3 cells were seeded at 12,500 and 25,000 cells per well in four separate CytoView-Z 96-well plates and barrier index was monitored over several days. At 92 hours, barrier index, a measurement of the integrity of the barrier formed by the cell layer, was calculated and compared across all four plates docked in Maestro TrayZ (Figure 2). As show in Table 1, the overall % CV for both densities was below 10%, indicating minimal plate-to-plate variability.
Case study: Dose response assay
Dose response analysis is well-suited for high-throughput screening assays. A wide range of treatments, with full dose response ranges, can be evaluated simultaneously with the Maestro TrayZ platform. SKOV3 cells were plated at 5,000 cells per well in four different 96-well CytoView-Z plates. Drugs (doxorubicin and paclitaxel) were serially diluted from stock solutions in the appropriate cell media. At 24 hours post cell seeding, compounds were added in a six-point concentration sweep with full-log intervals.
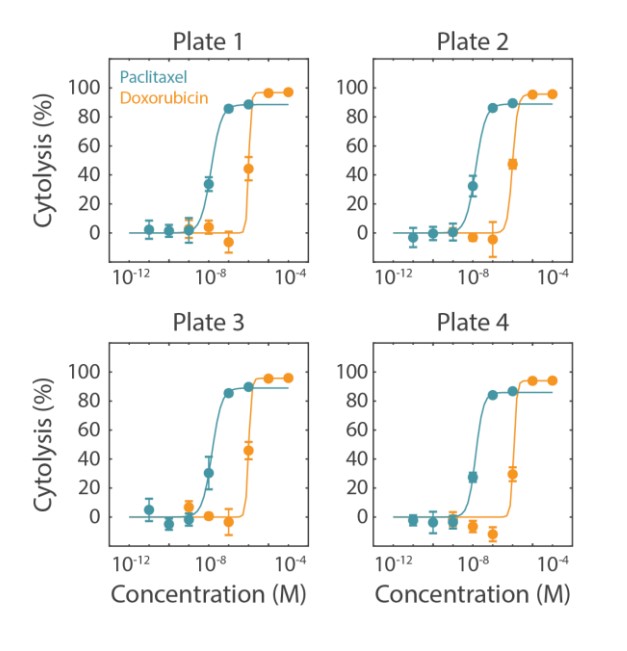
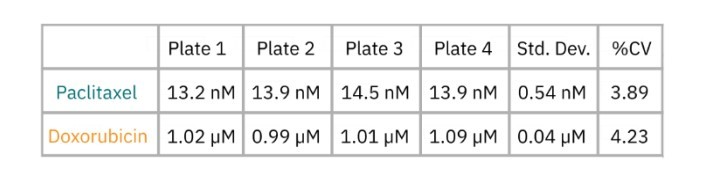
Cytolysis was computed relative to a “No Treatment Control” group and a “Full Lysis Control” group (data not shown) and the dose response analysis was performed for each compound. As illustrated by the data in Figure 3 and as shown in Table 2, the EC50 for each drug was calculated for each plate. The EC50 values are similar between plate replications and show minimal plate-to-plate variability as indicated as the overall % CV values which fall below the required 20% threshold.
Case study: CAR T cell-mediated cytotoxicity assay
To measure CAR T cell-mediated killing, CAR T cells were thawed and cultured according to the supplier recommendations. CAR T cells were maintained in CAR T cell medium for at least 16 hours prior to addition. At approximately 24 hours post SKOV3 cell plating, CAR T cells were resuspended at 10x the desired final concentration, and then 22 µL of the cell suspension was added at various effector to target (E:T) ratios. The same volume of media was added to negative (media only) control groups. Triton X-100 (1%) was added to full lysis control wells.
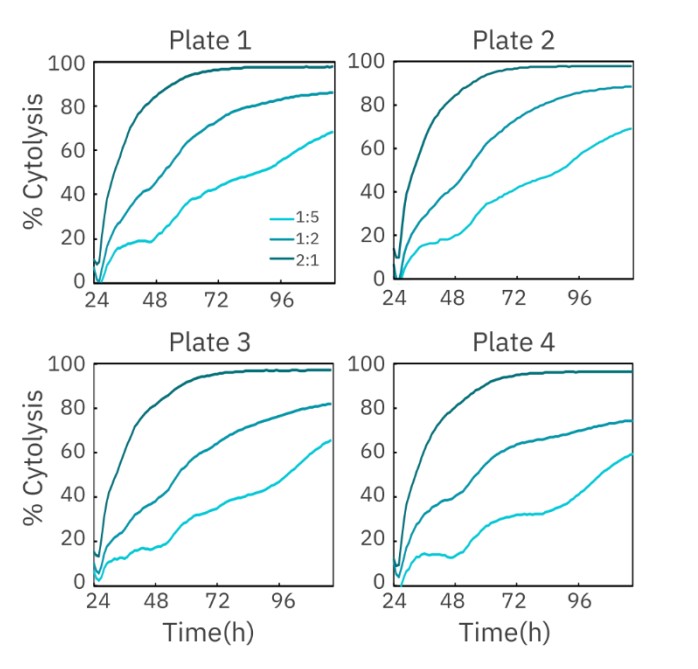
The cytolysis of HER2-expressing SKOV3 cells by HER2- specific CAR T cells was measured across four separate plates on TrayZ at three different E:T ratios (1:5, 1:2, and 2:1). As expected, SKOV3 cells treated with the highest number of CAR T cells (2:1) showed the greatest cytolysis, with near complete cell lysis by 72 hours (Figure 4).
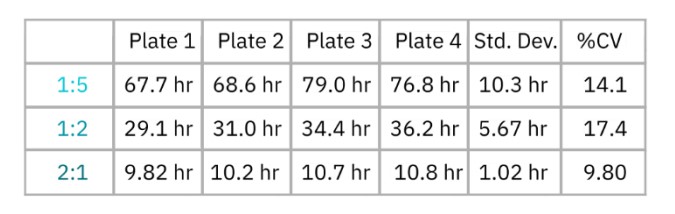
Real-time measurement of cell-mediated cytotoxicity allowed for the calculation of kill time 50 (KT50), defined as the time required for 50% cytolysis of the target cells. The KT50 was calculated for each plate at each E:T ratio, as well as the overall standard deviation and %CV across all four plates. As shown in Table 3, the %CV values for KT50 at each E:T ratio fell below the 20% threshold, indicating minimal inter-plate variability.
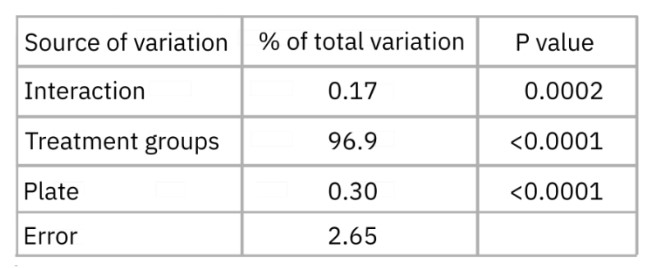
In addition, a two-way ANOVA analysis was performed and found the greatest source of variation to be different treatment groups as opposed to different plates at 96 hours (Table 4). Of note, the variation between plates was even less than the error (or unexplained variation).
Conclusion
The Maestro TrayZ high-throughput platform allows for simple, noninvasive, real-time monitoring of various in vitro assays, including cell proliferation, drug cytotoxicity, and immune-cell mediated killing of target cancer cells. These case studies illustrate that the Maestro TrayZ is an effective tool in the development, validation, and implementation of high-throughput assays that focus on assessing perturbations in cell behavior. Overall, these results highlight the reliability, minimal plate-to-plate variability, and robustness of the Maestro TrayZ.
References
Iversen, Philip, et al. "HTS Assay Validation; Assay Guidance Manual." Bethesda (MD): Eli Lilly & Company and the National Center for Advancing Translational Sciences (2012).
Authors
Denise Sullivan & Daniel Millard
Axion BioSystems, Atlanta, GA