Key Findings
>> LFP power increases in relevant frequency bands throughout maturation.
>> Pharmacological manipulation modifies the burst pattern and power distribution of LFPs.
Abstract
Advanced neuronal models, such as organoids, are promising platforms for studying brain development and establishing mature human phenotypes in vitro. Local field potentials (LFPs) provide an avenue to quantify the development of low frequency oscillations, which are reminiscent of in vivo brain rhythms. The objective of this work is to develop and validate an in vitro neuronal activity assay using low frequency LFP signals and traditional spike train analysis.
Introduction
Characterizing the collective activity of a cell population by assessing low frequency local field potentials (LFPs) formed in neuronal networks is a well-established method in neuroscience. Research has demonstrated that LFPs largely represent the summed input to a population of neurons by way of synchronized post-synaptic potentials.1 Although spike train analysis indicative of the output of individual neurons has been the primary approach to microelectrode array (MEA) assays, LFPs carry additional information about the excitatory inhibitory balance and functional activity of a neuronal network.
In electroencephalogram (EEG) literature, the appearance and prevalence of certain low frequency oscillations can be mapped to behavioral states such as deep sleep or heightened awareness.2 As in vitro neuronal models grow more sophisticated through techniques employing 3D structures, co-cultures, and human induced pluripotent stem cells (hiPSCs), they may begin to exhibit meaningful low frequency electrical signals as well.3 Development of easy-to use tools for recording and analyzing LFP signals will complement existing assays of functional spiking activity to enhance characterization of neuronal models.
Here, we highlight the ability of the Maestro MEA platform to concurrently collect and analyze spike trains and LFPs from cultured neuronal networks. We also demonstrate that characteristics relating to the shape or spectral content of LFP signals can be reliably measured and used to describe and differentiate neural activity patterns. For rat cortical neuron cultures, we demonstrate how the LFP shape changes over time and in response to modulating drugs.
Materials and Methods
Cells and reagents
Primary rat cortex neurons, RCN, (Cat. A1084002) were obtained from ThermoFisher (Waltham, MA). RCN media was composed of Neurobasal Plus Medium (Gibco, Cat. A3582901), Glutamax (Gibco, Cat. 35050061), B-27 Plus Supplement (Gibco, Cat. A3582801), and gentamicin (Gibco, Cat. 15710064). Amoxapine (Cat. 17347) was obtained from Cayman Chemicals (Ann Arbor, MI).
Cell plating
CytoView MEA 48- and 96-well plates were spotted with a 5 µL droplet of Poly-D-Lysine, PDL, (Gibco, Cat. A3890401) over the microelectrode array in each well. After 1 hour incubation at 37°C and 5% CO2, each well was washed with diH20 four times to remove any excess PDL and allowed to dry overnight in the biosafety cabinet. Then, RCNs were thawed according to supplier recommendations. Next, the cell suspension was transferred to a 15 mL conical tube and centrifuged at 300 x g for 5 minutes. The supernatant was aspirated, being careful not to disturb the cell pellet. Cell density and viability were determined using a hemocytometer. Cells were resuspended and diluted in appropriate media to the desired working concentration of 16,000,000 neurons/mL. Cells were then spotted over the array in a 5 µL droplet for each well and the plate was incubated at 37°C and 5% CO2 for 1 hour. Finally, additional media (200 µL for the 96-well plate and 300 µL for the 48-well plate) was added. Integrated humidity reservoirs on the CytoView MEA 96 were filled with sterile water to maintain humidity. Every 2-3 days during culture, 50% of the RCN media was replaced.
Drug dosing
At DIV 28, neurons were dosed with 3 µM amoxapine. Amoxapine was diluted from a stock solution in RCN media and was added at 10x the final concentration to treatment groups. Additional treatment groups included no treatment control (NTC) and 0.1% DMSO as a vehicle control. A 5-minute recording prior to dosing served as the baseline measurement. After drug dosing, the plate was incubated for 1 hour before another 5-minute recording was taken which served as the dosed condition.
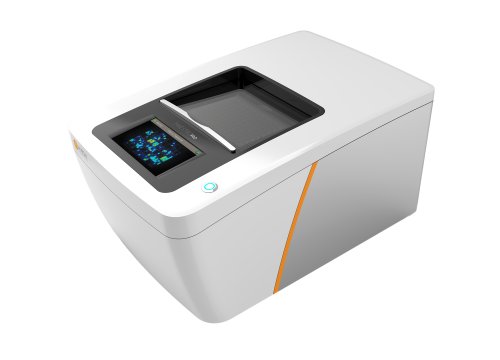
Neural activity recording with the Maestro MEA platform
The Neural Broadband Spontaneous configuration in AxIS Navigator was used to record spikes and LFPs from all electrodes in each well (Fig. 1) using a Maestro Pro. The temperature was set to 36°C, and legacy heater mode was activated. Prior to recording, plates were pulled from the incubator, placed in the Maestro Pro, and allowed to equilibrate for 5 minutes. After recording, plates were returned to the incubator.
LFP and spike train analysis
Spike detection was performed using AxIS Navigator (Axion BioSystems). Spikes were detected with a threshold of 6 standard deviations above the noise. LFP and spike train analysis were performed with the Neural Metric Tool (Axion BioSystems).
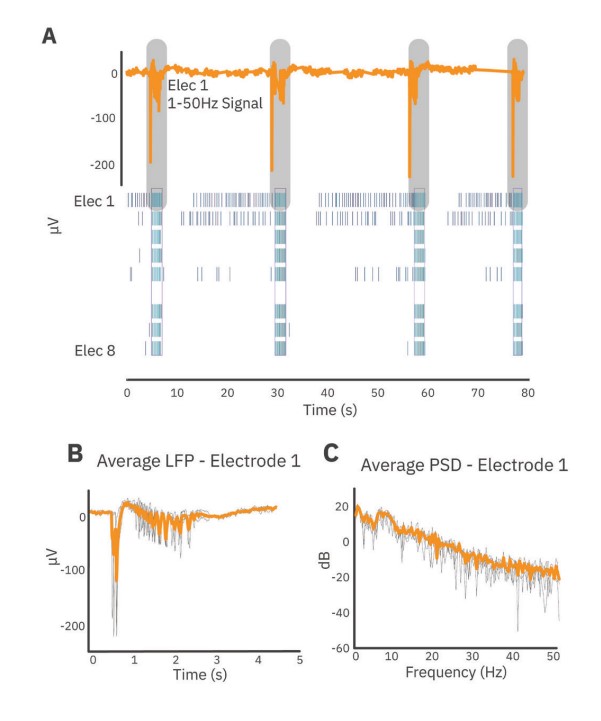
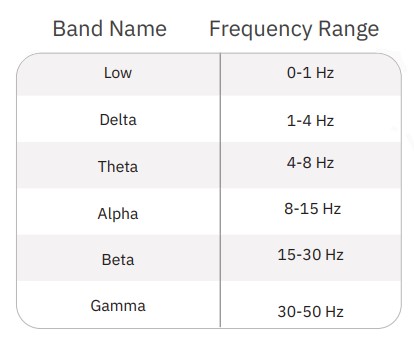
First, LFP events which occurred during network bursts were extracted (Fig. 2). For each electrode, LFPs were extracted starting 0.5 seconds before the start of the network burst and ending 4 seconds after the start of the network burst. Average LFPs and average power spectral density (PSD) curves were computed from these events using a periodogram approach. Prior to transformation to the frequency domain, LFP traces were down-sampled using an anti-aliasing filter from the 12.5 kHz acquisition rate to 100 Hz, preserving frequency content up to 50 Hz. PSDs were computed in µV2/Hz and log-transformed for scaling. Endpoints from the PSD were calculated on a per-well basis through integration of the well average PSD according to the following defined frequency bands:
Results
Distinct LFPs emerge from spiking activity patterns
The PSD provides information about the oscillatory content of a signal. Here, we demonstrate the relationship between spiking activity, LFP shape, and oscillatory content of the PSD. Figure 3 presents three distinct examples of neuronal activity patterns in cultured cortical neurons at 28 days in vitro. Weakly synchronized network bursts in culture exhibited flat LFPs on all electrodes in the well (Fig. 3A), and the average PSD for LFP events decreases as a function of frequency without presenting a peak at any frequency.
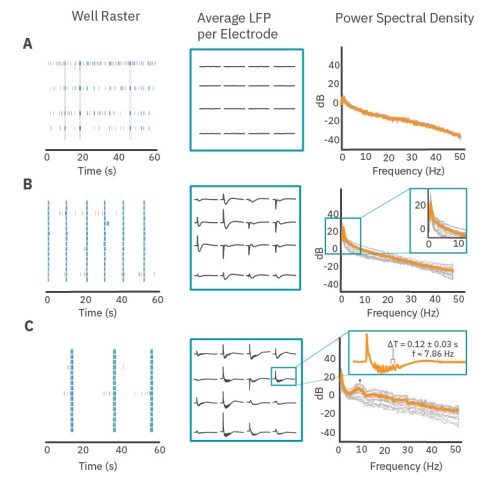
Coordinated, synchronized bursts exhibited slow deflections in voltage during network bursts. While the shape of an LFP was consistent on each electrode, electrodes in different parts of the well could have inverted shapes, different magnitudes, or little to no voltage deflection at all (Fig. 3B, middle). The average PSD reflects this increase in voltage deflections with a peak below 1 Hz (Fig. 3B). Cultures that contained oscillations within the network burst exhibited more complex LFPs with oscillations in voltage following an initial deflection. These oscillations in the low frequency signal (Fig. 3C) were very prominent and occurred with an average period of 0.127 seconds – a frequency of 7.86 Hz. The average PSD of LFP events in this well contains a peak near 7.86 Hz which is reflective of the presence of these oscillations in the LFP. This indicates that quantifying peaks in the PSD curves (both location and height of peak) may be an approach to characterize coordinated activity in neuronal cultures.
LFPs become more complex as neuronal cultures mature and develop
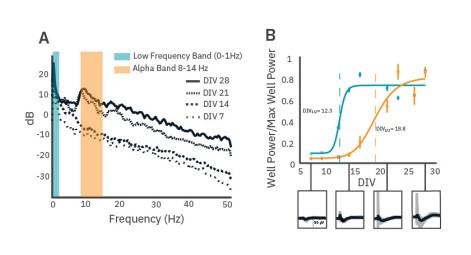
As cultures mature post-plating, significant changes can occur in the LFP shape and frequency content. A 96-well CytoView plate containing rat cortical neuron cultures was monitored over 28 days using the Maestro Pro. At DIV 7, deflections in the LFP trace within network bursts are small in magnitude and brief. Total signal power increases over maturation and, by DIV 21, substantial peaks in alpha band power are identifiable (Fig. 4A). Large voltage deflections in LFPs, identifiable in the PSD by low frequency band power, appear relatively stable by as early as DIV14, whereas alpha band oscillations in the network burst-triggered LFPs first appear at DIV 16 and become more prevalent within wells after three weeks of maturation (Fig. 4B).
Amoxapine accelerates bursting and eliminates intraburst alpha band oscillations
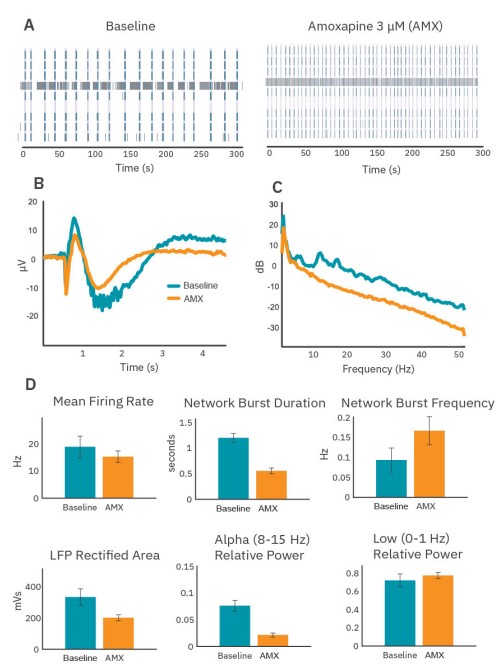
After maturation, wells were dosed with 3µM amoxapine, a nonselective drug that primarily impacts serotonin and norepinephrine signaling. Amoxapine induced significant qualitative changes in the spiking activity (Fig. 5A), average LFP (Fig. 5B), and average PSD (Fig. 5C). Although amoxapine had only a small impact on the mean firing rate of the neurons in culture, the bursting organization changed substantially, with network bursts becoming shorter and more frequent (Fig. 5D).
Quantifiable changes in the LFP and PSD accompanied the changes in network burst dynamics. Average LFPs became shorter and smaller, and ripples were eliminated (Fig. 5B). Area under the curve of the rectified average LFPs and the power measured at low frequency both decreased (Fig. 5D), consistent with the decrease in network burst duration. In addition, power in the alpha band was effectively eliminated. In fact, all high frequency content in network burst-triggered LFPs was greatly diminished under amoxapine (Fig. 5C).
Conclusion
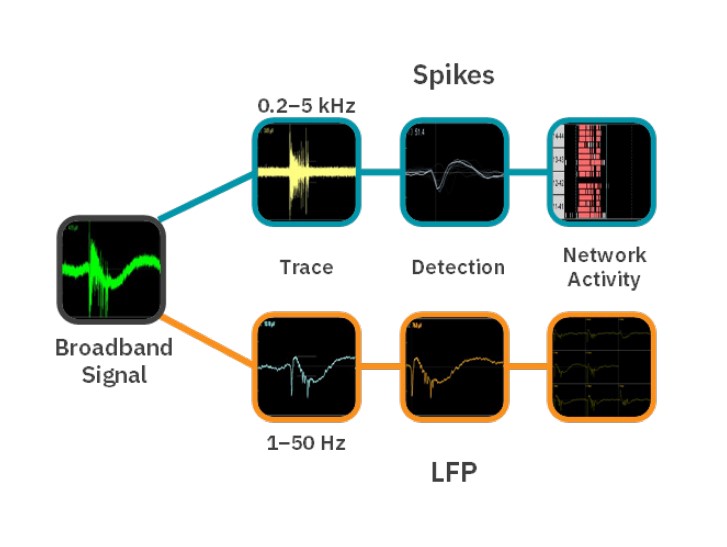
Neural signals can be filtered into high frequency spike traces and low frequency LFP traces and analyzed independently. During coordinated network activity, rat cortical cultures exhibit large voltage deflections in the LFP trace. Average power spectral density of these events can highlight features of the functional activity. For example, cultures with highly synchronous, regular network bursts display increased power in sub-1Hz frequencies, whereas cultures with strong oscillations display increased power at relevant frequencies. Also, LFP shape and spectral content change throughout maturation; as neural cultures mature, LFPs become larger in magnitude and may display higher frequency oscillations. Finally, LFP shape and spectral content can also be modified pharmacologically. Taken together, these results demonstrate that the quantification of LFP shape and spectral content provides a complementary technique for characterizing the functional activity of neuronal networks in vitro.
References
[1.] Buzsáki, G., et al. The origin of extracellular fields and currents — EEG, ECoG, LFP and spikes. Nature Reviews Neuroscience (2012).
[2.] Berens, P., et al. Feature selectivity of the gamma-band of the local field potential in primate primary visual cortex. Frontiers in Neuroscience (2008).
[3.] Trujillo, C.A., et al. Complex Oscillatory Waves Emerging from Cortical Organoids Model Early Human Brain Network Development. Cell Stem Cell (2019).
Authors
Parker Ellingson, Denise Sullivan, Daniel Millard
Axion BioSystems, Atlanta, GA