Key Findings
>> Live-cell imaging enabled quantifiable, real-time monitoring of single cancer cell migration.
>> HeLa cells exhibited chemotactic migration to an FBS gradient, whereas C6 cells displayed no apparent chemotactic migration.
Introduction
Worldwide, cancer is responsible for around 10 million mortalities every year1. The leading cause of cancer-related death is not the primary tumor, but cancer metastasis: malignant cells invade tissues other than where the primary tumor is located and spread in those tissues1. Fundamental cancer research is one of the key factors in the World Health Organization’s strategy to reduce cancer mortality1, and investigating the underlying mechanisms for metastasis can provide important information for the main clinical problem.
In cancer metastasis, the migration of single cells is largely affected by chemical cues, which provide direction for migration to the cells via chemotaxis2: the single cells migrate along a concentration gradient of a chemoattractant3. Various chemoattractants have been described for commonly investigated cell lines. For instance, HeLa cells (cervical cancer cells) have been reported to migrate towards higher concentrations of fibronectin4 and stromal cell-derived factor 1α5. The rat glioma cell line C6 has been described to be attracted by bradykinin6. A commonly used supplement in cell culturing that contains all of the aforementioned chemoattractant molecules is fetal bovine serum (FBS; the blood serum of an unborn calf )7-9.
Therefore, FBS provides an interesting and straightforward model system for the chemical cues provided to cancer cells.
However, in order to study the behavior of cancer cells in response to chemical cues, accurate cell tracking in an environment with a chemoattractant gradient is required. Multiple cell culture vessel designs have been made to provide a chemoattractant gradient to the cells10-12, but the imaging and monitoring of cells in these vessels can provide practical issues. Currently, the most commonly used live-cell imaging setup is a microscope with sufficient magnification and a stage-top incubation box to regulate the culture conditions. Although these microscopes have the required optical properties for accurate imaging and cell tracking, there are practical issues when using such a setup for live-cell imaging. The regulation of the culture conditions in the incubation box is more sensitive to variations compared to a dedicated incubator13,14. Besides that, images are only captured at certain time points, but the microscope is unavailable for (end-point) imaging by other users during the entire live imaging experiment. A system that could overcome these issues is the Axion Lux3 BR Duo Kit. This dedicated system for live-cell imaging fits in a regular incubator and therefore enables culture monitoring in a constant and optimal culture environment. The optical properties of the devices provide high-quality imaging, as well as accurate cell tracking. By connecting two devices within the same incubator to a single laptop, two cultures can be monitored simultaneously and compared side-by-side, without occupying a microscope for other lab members. In this proof of-concept study, we determine the effect of an FBS gradient on the directed migration of cancer cell lines using side-by-side high-quality live-cell imaging. The Lux3 BR Duo Kit was used to monitor two cancer cell lines exposed to an FBS gradient or constant FBS concentration. Cells were tracked over time, and this provided fundamental insight into the chemotactic migration of cancer cells, which may ultimately be related to cancer metastasis.
Materials and Methods
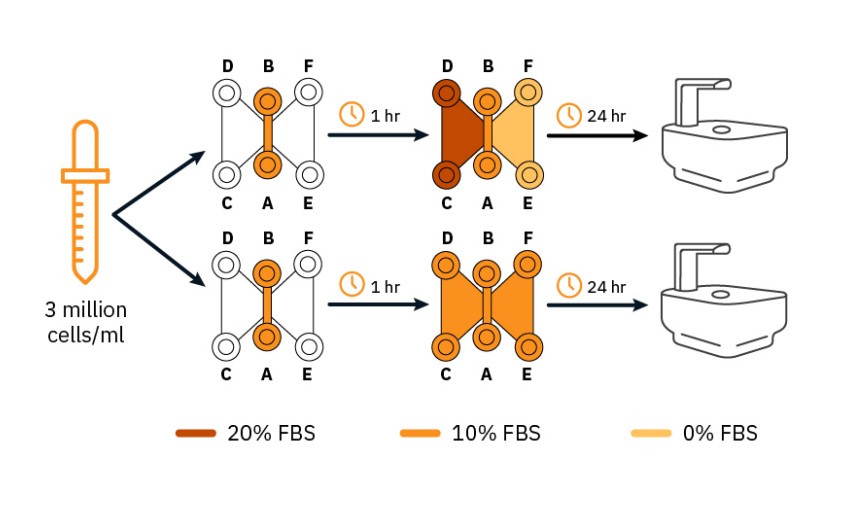
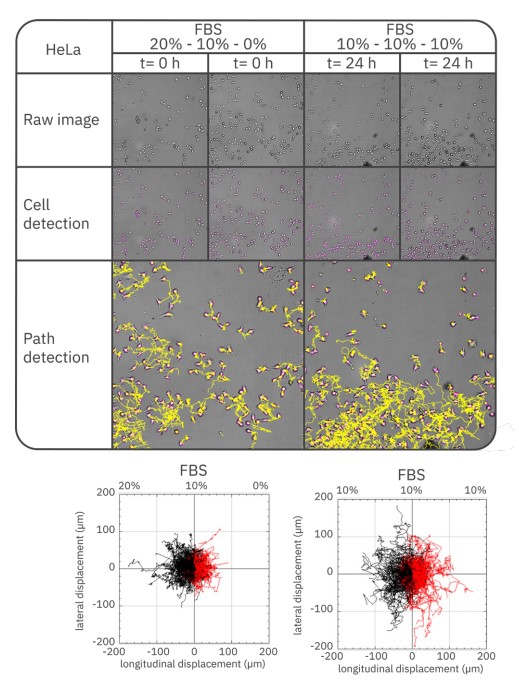
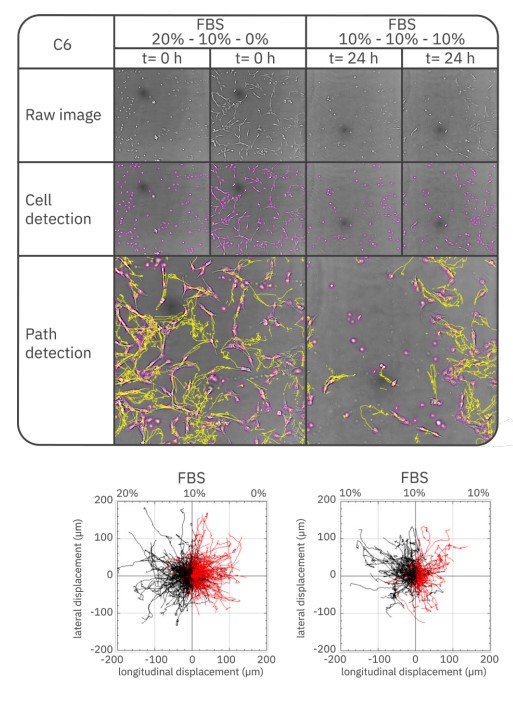
HeLa cells (Innoprot P20107) and C6 cells (ATCC CCL-107) were cultured to sub-confluency in DMEM (Gibco) supplemented with 10% FBS (Gibco) and 1% pen-strep (Gibco) under standard culture conditions (37°C; 5% CO2). Each of the cancer cell lines was trypsinized, counted using the Axion Exact, and re-suspended at 3 million cells/mL, in medium with 10% FBS. 6 µl of each cell suspension was seeded in the the channel of the µ-Slide Chemotaxis (ibidi, 8036), resulting in 18,000 cells per channel. Cells were allowed to adhere for 1 h in the incubator, after which 65 µl culture medium (DMEM, FBS, pen-strep) was added to each of the reservoirs. For the samples with chemoattractant gradient, 20% FBS was added to the reservoir on the left side (filling port C and D) and 0% FBS to the reservoir on the right side (filling port E and F). For the control samples, 10% FBS was added to both reservoirs (Fig. 1). µ-Slides were placed on the Lux3 BR Duo Kit inside the cell culture incubator (37°C; 5% CO2). High-quality images of the cultures were made using this setup: cultures were monitored for 24 h, taking a snapshot every 5 min. Afterwards, images were exported from the Axion Portal for further analysis: single cells were tracked with FIJI-plugin TrackMate15. Tracked paths were converted to chemotaxis plots with FIJI-plugin Chemotaxis and Migration Tool16. Color-coding was used for effective cell migration over the full 24 h towards the left medium reservoir (black) or the right reservoir (red).
Results
Representative images from the time-lapses of the cultures with FBS gradient or constant FBS concentration are displayed in Fig. 2 (HeLa cells) and Fig. 3 (C6 cells). These images include the raw image and image with detected cells at the start and endpoint, as well as the trajectories for all cells found by path detection. Longitudinal displacement (along the FBS gradient) and lateral displacement (perpendicular to the gradient) are shown in the trajectory plots, with negative longitudinal displacement indicating chemotaxis towards the chemoattractant reservoir – for the samples exposed to the gradient. Visual inspection shows that the Lux3 BR image enabled the cell tracking plugin to detect all cells. From the cell tracking, it can be seen that the HeLa cells migrated a larger distance from their origin in a constant FBS concentration compared to the samples exposed to a gradient. However, the HeLa cells showed a slight preference to migrate towards the higher FBS concentration when exposed to the chemoattractant gradient. The C6 cells seemed to migrate a slightly smaller distance from the origin in the constant FBS concentration compared to the FBS gradient. However, these cells also displayed less directed migration – and therefore no clear chemotactic migration – in an FBS gradient.
Discussion
Cancer metastasis is the main cause of cancer related mortalities, therefore cell migration is an important topic in cancer research. High-quality live-cell imaging is a prerequisite for accurate cell tracking, which provides fundamental insight into mechanisms driving metastatic cell migration. One of these mechanisms is chemotaxis, where cells migrate along an increasing gradient of a chemoattractant. This research aimed to determine the effect of an FBS gradient on the directed migration of cancer cell lines, using side-by-side high-quality live-cell imaging with the Lux3 BR Duo Kit. These devices provided high-quality images that were immediately applicable to the analysis software, enabling easy and accurate single-cell tracking. From this tracking, it was observed that HeLa cells preferred to migrate towards the higher FBS concentration, whereas this was less clear for the C6 cells.
Cervical cancer is amongst the most commonly metastasizing primary tumors, with metastases found in bone, liver, and lung tissue17 Glioma metastases, however, are a very rare phenomenon18,19. The clinical prevalence of each of these metastases could potentially be related to how much the blood serum – modeled by the FBS in this research – acts as a chemoattractant to the cells. Since spreading via the bloodstream is a prominent mechanism for metastasis17, directed and possibly chemotactic migration of the tumor cells towards a blood vessel can initiate metastasis. The cervical cancer cell line HeLa displaying more chemotactic migration in this research compared to the glioma cell line C6 seems to be in line with the clinical prevalence of the respective metastases. The FBS that was applied as a chemoattractant in this research provided an experimentally straightforward model system. Besides that, directed migration towards blood vessels was mimicked with this setup. However, FBS has a variable and complex composition20, therefore providing little insight into the specific molecule(s) responsible for the directed migration of the investigated cells. It should also be considered that FBS has other properties that affect cell behavior besides chemotactic migration: the FBS concentration in cell culture can also influence cell proliferation21. Although no clear difference in proliferation rate in the high and low FBS concentrations could be observed, the cell migration could still have been affected by other FBS-related processes. Therefore, follow-up experiments in the same setup using individual chemoattractants can provide more detailed information on cellular behavior.
The high-quality images made by the Lux3 BR Duo Kit were directly suitable for the TrackMate plugin. Therefore, automated cell tracking could be performed easily and quickly: results were obtained within minutes. Lower-quality images would have required manual adjustments to the cell tracking – which can lead to inaccurate results. This also would have slowed down the analysis, probably to hours or even days, since tracking on hundreds of images should have been checked and manually adjusted. Therefore, the image quality of the Axion Lux3 BR Duo Kit proved its added value to this research.
References
[1.] World Health Organization (2021). Fact sheet: Cancer. Retrieved from: https://www.who.int/news-room/fact-sheets/detail/ cancer.
[2.] Roussos ET, Condeelis JS, Patsialou A (2011). Chemotaxis in cancer. Nat Rev Cancer, 11(8), 573-587.
[3.] Iijima M, Huang YE, Devreotes P (2002). Temporal and spatial regulation of chemotaxis. Dev Cell, 3(4), 469-478.
[4.] Sugihara K, Saito T, Okadome M, Sonoda K, Kobayashi H, Kamura T, Tsukamoto N, Nakano H (1994). The promotion of invasion through the basement membrane of cervical carcinoma cells by fibronectin as a chemoattractant. Cancer Lett, 79(2), 167-173.
[5.] Sun Y, Cheng Z, Ma L, Pei G (2002). β-Arrestin2 is critically involved in CXCR4-mediated chemotaxis, and this is mediated by its enhancement of p38 MAPK activation. J Biol Chem, 277(51), 49212-49219.
[6.] Montana V, Sontheimer H (2011). Bradykinin promotes the chemotactic invasion of primary brain tumors. J Neurosci, 31(13), 4858-4867.
[7.] Hayman EG, Ruoslahti E (1979). Distribution of fetal bovine serum fibronectin and endogenous rat cell fibronectin in extracellular matrix. J Cell Biol, 83, 255-259.
[8.] Marques CS, Soares M, Santos A, Correia J, Ferreira F (2017). Serum SDF-1 levels are a reliable diagnostic marker of feline mammary carcinoma, discriminating HER2-overexpressing tumors from other subtypes. Oncotarget, 8(62), 105775.
[9.] Zhou Y, Wang W, Wei R, Jiang G, Li F, Chen X, Wang X, Long S, Ma D, Xi L (2019). Serum bradykinin levels as a diagnostic marker in cervical cancer with a potential mechanism to promote VEGF expression via BDKRB2. Int J Oncol, 55(1), 131-141.
[10.] Guy JB, Espenel S, Vallard A, Battiston-Montagne P, Wozny AS, Ardail D, Alphonse G, Rancoule C, Rodriguez-Lafrasse C, Magne, N. (2017). Evaluation of the cell invasion and migration process: a comparison of the video microscope-based scratch wound assay and the boyden chamber assay. J Vis Exp, 129, e56337. [11.] Nogalski MT, Chan GC, Stevenson EV, Collins-McMillen DK, Yurochko ADA (2012). Quantitative evaluation of cell migration by the phagokinetic track motility assay. J Vis Exp, 4(70), e4165.
[12.] Chen Y-C, Allen SG, Ingram PN, Buckanovich R, Merajver SD, Yoon E (2015). Single-cell migration chip for chemotaxis-based microfluidic selection of heterogeneous cell populations. Sci Rep, 5, 9980.
[13.] Frigault MM, Lacoste J, Swift JL, Brown CM (2009). Live-cell microscopy–tips and tools. J Cell Sci, 122(6), 753-767.
[14.] Ettinger A, Wittmann T (2014). Fluorescence live cell imaging. Methods Cell Biol, 123, 77-94.
[15.] Tinevez J-Y, Perry N, Schindelin J, Hoopes GM, Reynolds GD, Laplantine E, Bednarek SY, Shorte SL, Eliceiri KW (2017). TrackMate: An open and extensible platform for single-particle tracking. Methods, 115, 80–90.
[16.] ibidi (n.d.). Chemotaxis and Migration Tool. Retrieved from: https://ibidi.com/chemotaxis-analysis/171-chemotaxis-and- migration-tool.html.
[17.] NIH – National Cancer Institute (2020). Metastatic Cancer: When Cancer Spreads. Retrieved from: https://www.cancer.gov/ types/metastatic-cancer. [18.] Alvord EC (1976). Why do gliomas not metastasize?. Arch Neurol, 33(2), 73-75.
[19.] Lun M, Lok E, Gautam S, Wu E, Wong ET (2011). The natural history of extracranial metastasis from glioblastoma multiforme. J Neurooncol., 105(2), 261-273.
[20.] van der Valk J, Bieback K, Buta C, Cochrane B, Dirks W, Fu J, Hickman JJ, Hohensee C, Kolar R, Liebsch M, Pistollato F, Schulz M, Thieme D, Weber T, Wiest J, Winkler S, Gstraunthaler G (2018). Fetal bovine serum (FBS): past–present–future. Altex, 35, 99-118.
[21.] Ibrahim B, Stange J, Dominik A, Sauer M, Doss S, Eggert M (2020). Albumin promotes proliferation of G1 arrested serum starved hepatocellular carcinoma cells. PeerJ, 8, e8568.
Authors
Marc van Vijven, Lieke Stemkens, Nathalie van de Laar
Axion BioSystems, Atlanta, GA