Key Findings
>> An antibody-tethering method for in vitro quantification liquid tumor cell lines
>> Proliferation of liquid tumor cell lines can be tracked in real time
>> CD19-targeted CAR T cells kill in an antigen-specific and dose-dependent manner
Abstract
Immunotherapy has emerged as a promising avenue of treatment for cancer, particularly for bloodborne malignancies such as acute lymphoblastic leukemia but in vitro assays of liquid tumor cell lines can be difficult to accurately quantify. Here, we demonstrate real-time immune cell-mediated killing of nonadherent cancer cell lines (K562, Raji, and Daudi) using the Maestro Z platform.
Introduction
Cancer remains one of the most prevalent and deadly diseases in the world, with 19.3 million new cases and 10.0 million deaths reported in 2020 (Sung et al., 2021). Immunotherapy has shown potential to be a powerful tool in treating and, in some cases, even eradicating cancers of various origins. Cellular immunotherapies, such as those using chimeric antigen receptor (CAR) T cells, have proved to be particularly efficacious and have led to improved patient outcomes in the clinic. CAR T therapy has been successful in targeting blood cancers such as large B cell lymphoma, and all FDA-approved CAR T therapies target hematological malignancies (Pan et al., 2022).
To develop immunotherapies for cancer patients, in vitro assessments of therapeutic products must be performed to ensure their quality and efficacy. Potency assays that measure immune cell killing are critically important.
Hematological cancer models are traditionally in suspension. Since many assays rely on the attachment of cells to the bottom of plates, using non-adherent cells can pose a challenge. Here, we demonstrate a simple antibody-tethering technique for in vitro cell killing assays of three non adherent liquid tumor cell lines:
- K562 – lymphoblast cells from chronic myelogenous leukemia patient
- Raji - lymphoblast-like cells from Burkitt’s lymphoma patient
- Daudi – B lymphoblasts from Burkitt’s lymphoma patient
We track real-time proliferation of the target cell lines and quantify CD19-targeted CAR T cell-mediated killing. In total, our results demonstrate that the Maestro Z is a powerful tool for assessing the quality of immunotherapies against liquid tumor cell lines.
Materials and Methods
Cells and reagents
K562 (Cat. CCL-243), Raji (Cat. CCL-86), and Daudi (Cat. CCL-213) cells were obtained from ATCC (Manassas, VA). K562 media was composed of Iscove's Modified Dulbecco's Medium, Glutamax Supplement (Gibco, Cat. 31980030), 10% FBS (GeminiBio, Cat.900-108), and 1% penicillin/streptomycin (Gibco, Cat. 15140122). Raji and Daudi media was composed of RPMI Medium 1640 (Gibco, Cat. 11875093), 10% FBS (GeminiBio, Cat.900- 108), and 1% penicillin/streptomycin (Gibco, Cat. 15140122). CAR T cells targeting CD19 (CD19 scFvCD28-CD3ζ, Cat. PM-CAR1001-1M) and CAR T cell media (Cat. PM-CAR2001) were obtained from ProMAB Biotechnologies (Richmond, CA).
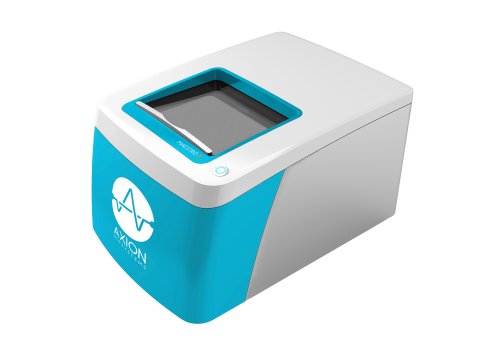
Maestro Z assay platform
The Maestro Z platform (Axion BioSystems) uses impedance measurements (ohms, Ω) to quantify the presence of cells on electrodes embedded in the bottom of the wells of CytoView-Z plates (Axion BioSystems). Cellular impedance is a well-established technique for measuring cell attachment, spreading, proliferation, coupling, membrane integrity (cell death), and subtle changes in cell conformation. Detection is noninvasive and label-free, so it can quantify dynamic cellular responses over minutes, hours, and days. The Maestro Z's built-in environmental chamber finely controls temperature and CO2, ensuring a consistent, optimal experimental environment.
Target cell density sweep on the Maestro Z
Tethering antibody solutions (all purchased from R&D Systems) were diluted in PBS. For Raji and Daudi cells, the tethering antibody solution was 4 µg/mL anti-CD40 (Cat. AF632). For K562 cells, the tethering antibody solution was 5 µg/mL anti-CD71/TfR (Cat. AF2474). CytoView-Z 96 plates (Axion BioSystems) were coated with 50 µL of antibody solution per well and incubated at 4°C overnight. After incubation, excess surface coating was aspirated from each well. Then, 100 µL of appropriate cell medium was added per well, and the plate was docked on the Maestro Z platform to record a media reference.
Daudi, Raji, and K562 cells were thawed and cultured in their respective media according to the supplier recommendations, passaging as needed. The cell suspension was then transferred from the culture flask to a 15 mL conical tube and centrifuged at 1,000 rpm for five minutes. The supernatant was aspirated, being careful to not disturb the cell pellet. Cell density and viability were determined using a hemocytometer. Cells were resuspended and diluted in appropriate media to the desired working concentration. Cells were added at 25,000, 50,000, or 100,000 cells in 100 µL per well. Media alone was added to “Media Only Control” wells. The plate was allowed to rest at room temperature for one hour prior to docking on the Maestro Z, which incubated the plate at 37°C and 5% CO2. Integrated humidity reservoirs on the CytoView-Z 96 plate were filled with sterile water to maintain humidity.
Live-cell imaging of liquid tumor cell lines
Live-cell imaging of tethered cancer cells lines were performed by the Omni platform (Axion BioSystems).
CAR T cell-mediated killing assay
CytoView-Z 96 plates were coated with antibody solution, and all target cell types were thawed and cultured, both in the same manner as described above. Cells were added at 50,000 cells per well in 100 µL. The plate was allowed to rest at room temperature for one hour prior to docking on the Maestro Z, which incubated the plate at 37°C and 5% CO2. Integrated humidity reservoirs on the CytoView-Z 96 were filled with sterile water to maintain humidity. To measure CAR T cellmediated killing of target cells, CD19-targeted CAR (CD19-CAR) T cells were thawed according to the supplier recommendations. At approximately 24 hours post target cell plating, CAR T cells were resuspended at 10x the desired final concentration, and then 22.2 µL of the cell suspension was added at the following E:T ratios: 1:5, 1:2, 1:1, 2:1, and 5:1. CAR T cells at each of these E:T ratios were also added to antibody-coated wells with no target cells (effector-only control wells). The same volume of media was added to “No Treatment Control” and “Media Only Control” groups. Triton X-100 (1%) was added to “Full Lysis Control” wells. The plate was then allowed to rest for 30 minutes at room temperature before again docking onto the Maestro Z. Target cell proliferation and death was then monitored over time on the Maestro Z.
Endpoint calculations
Treatment group resistance measurements were corrected for “Treatment Only Control” values (PBMCs alone or CAR T cells alone) using the AxIS Z software’s Linked Controls feature. %Cytolysis was used to quantify cell death and was calculated using the following equation: where ZnoTx(t) is a time series and the mean of the no treatment control wells. ZFullLysis(t) is a time series and the mean of the full lysis control wells. %Cytolysis and kill time 50 (KT50) were calculated and exported using the AxIS Z software.
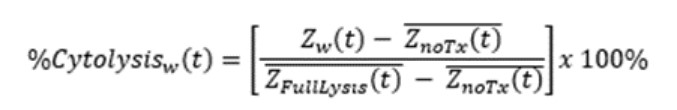
where
ZnoTx(t) is a time series and the mean of the no treatment control wells.
ZFullLysis(t) is a time series and the mean of the full lysis control wells.
%Cytolysis and kill time 50 (KT50) were calculated and exported using the AxIS Z software.
Dose response analysis
The cytolysis EC50 E:T ratio was calculated by the AxIS Z software using a Hill equation model:
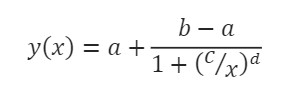
where the lower (a) and upper (b) asymptotes define the minimum and maximum value of the best fit line, respectively. The dose at half-maximal response (c) is the EC50. Finally, the Hill slope (d) gives the slope at the steepest part of the curve.
Results
Real-time proliferation can be tracked in antibody-tethered cells
To quantify proliferation rates of liquid tumor cell lines, cells were tethered to the bottom of the wells using antibodies that are specific for antigens located on the cell surface. Once tethered, resistance measurements accurately reflect cellular proliferation.
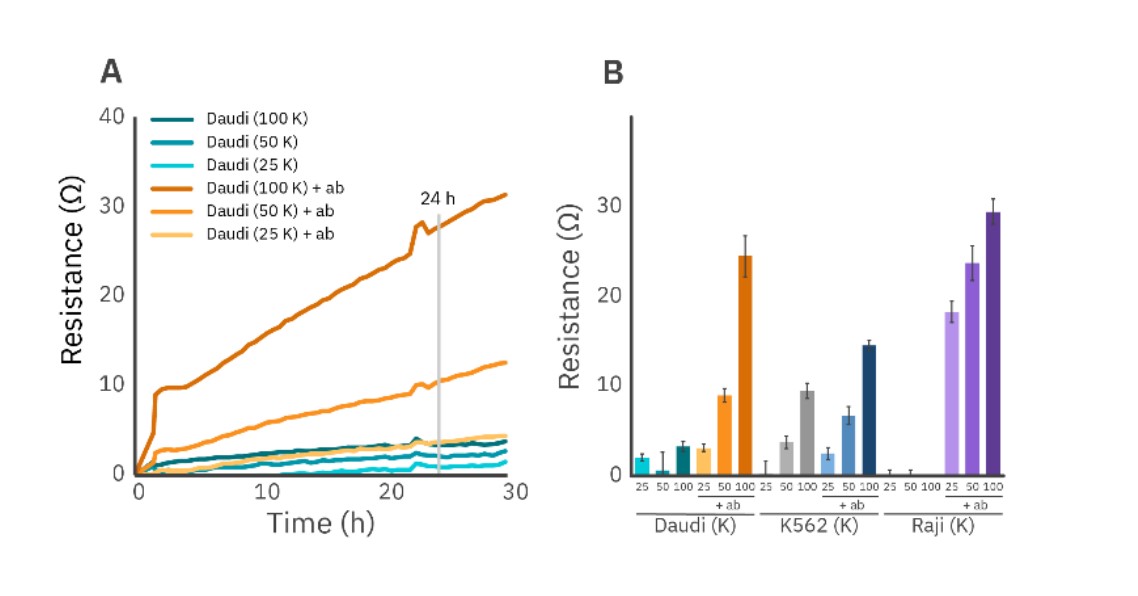
Figure 1 illustrates a density sweep of three different non-adherent cell types, Daudi, K562, and Raji cells, seeded in a CytoView-Z 96 plate. Cells were plated with or without the following antibodies adsorbed to the well surface: anti-CD71 (5 µg/mL) antibody for K562 cells and anti-CD40 (4 µg/mL) for Daudi and Raji cells.
In general, antibody-tethered liquid tumor cells had larger resistance values (Fig. 1). For example, 100K tethered Daudi cells had 8x larger resistance values over its untethered counterpart. Further, the density sweep of tethered Daudi cells showed a near-linear relationship with resistance over time, whereas untethered Daudi cells did not (Fig. 1A). Similar impedance results at 24 hours post-seeding were obtained for K562 and Raji cells (Fig. 1B).
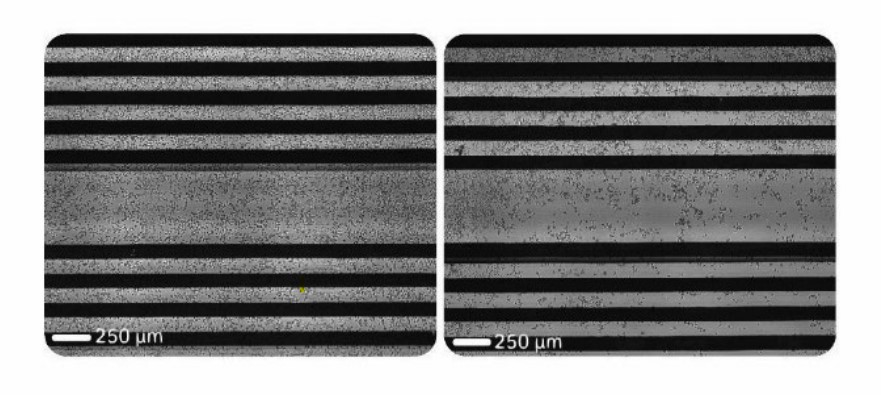
Imaging revealed that untethered cells were distributed unevenly across the well, whereas tethered Daudi cells uniformly adhered to the well bottom (Fig. 2). These results demonstrate that antibody tethering improves cell attachment and increases the impedance signal measured by the Maestro Z.
CD19-CAR T cells kill liquid tumor cells in an antigen-specific manner
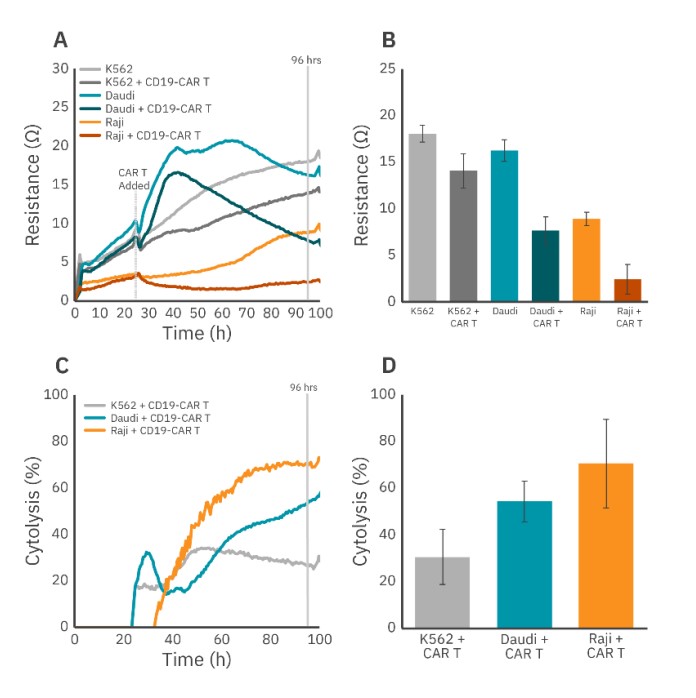
At present, the majority of clinically approved CAR T cell therapies have targeted CD19 (Smole, 2022), an antigen found of the surface of human B lymphocytes (Wang et al., 2012). Thus, we measured the ability of CAR T cells targeted toward the CD19 antigen to kill CD19+ cancer cells (Daudi and Raji). We also included the CD19- cancer cell line K562 as a negative control.
All target cell types were seeded into CytoView-Z 96 plates at the same density (50K) using the previously discussed antibodies and monitored using the Maestro Z. At 24 hours post seeding, the target cells were dosed with CD19-CAR T cells at a 1:1 ratio. Figure 3 shows time series and endpoint (96 hours) values of dosed and undosed target cells of each cell type for both resistance and cytolysis. CAR T dosing of the CD19+ Raji and Daudi cells led to significant increases in cytolysis (Fig. 3B and 4D). This effect was far less pronounced for the CD19- K562 cells. Cytolysis of K562 cells by CD19-CAR T cells was nearly 2 times less than that of the Daudi cells (30.5% vs. 54.3%) and over 2 times less than that of Raji cells (30.5% vs. 70.4%) (Fig. 3D). These results show that real-time CAR T cell-mediated, antigen-specific killing of tethered target cells can be monitored on the Maestro Z.
CD19-CAR T cells kill Daudi cells in a dose-dependent manner
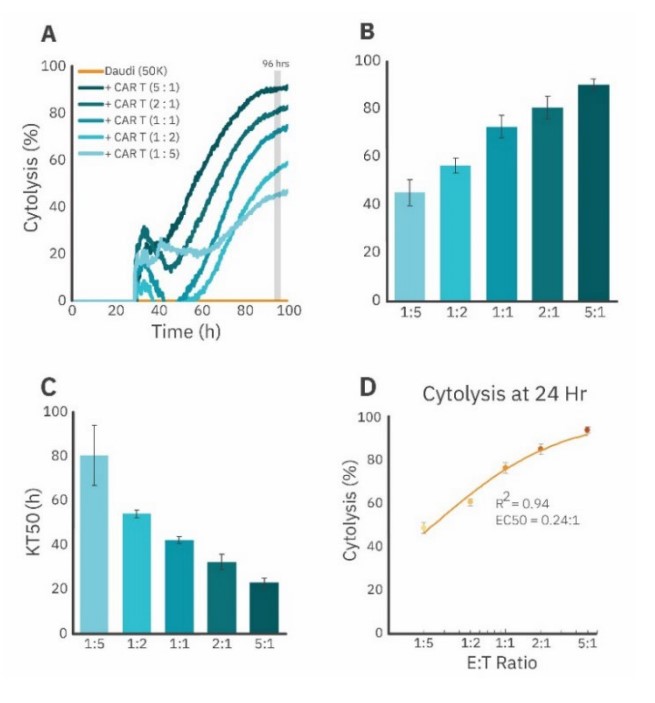
The potency of CAR T cellular products is often tested over a wide range of E:T ratios to illustrate the dose-dependence of the cells’ cytotoxicity (Bishop et al., 2018; Rennert et al., 2021). An in vitro potency assay, then, should be sensitive to CAR T killing over a range of CAR T cell doses. Therefore, we sought to measure CAR T killing of non-adherent target cells at multiple E:T ratios on the Maestro Z. We seeded 50K Daudi cells into the wells of a CytoView-Z 96 plate. via antibody-tethering and, at 24 hours after target cell seeding, dosed the Daudi cells with 5 different E:T ratios of CD19-CAR T cells (1:5, 1:2, 1:1, 2:1, and 5:1). The time course of the cytolysis data is presented in Figure 4A, with the 96 hour time point used for the dose response analysis (Fig. 4B). As expected, increasing doses of CAR T cells led to increased cytolysis of Daudi cells. We also measured the kill time 50 (KT50), an endpoint that represents the amount of time required for a particular CAR T dose to kill 50% of the Daudi cells. Increasing doses of CAR T cells had decreasing KT50 values (Fig. 4C).
Finally, we generated a dose-response curve of CD19- CAR T killing at 96 hours post dose (please see “Curve fitting and EC50 estimation” above for more details) (Fig. 4D). This curve had a high degree of fit for the data (R 2 = 0.94) and gave an EC50 E:T ratio of 0.24:1. Taken together, these results demonstrate the sensitivity of the assay to generate dose-response data for CAR T cell killing of liquid tumor target cells.
Conclusions
Immunotherapy has shown great promise for treating cancer. These therapies have had the greatest success in targeting hematological malignancies, and, thus, methods are needed to measure CAR T cell-mediated killing of liquid tumor cells in vitro reliably and easily in a high throughput manner. Here, we demonstrate a method for in vitro immune cell-mediated killing assays with non-adherent target cell types. We monitored proliferation of antibody-tethered nonadherent cancer cell lines and effector cell-mediated killing using the Maestro Z. Further, we were able to measure antigen-specific CAR T cell-mediated cytotoxicity and investigate dose-dependent relationships of CAR T killing of nonadherent cells in a label-free, real-time manner. In summary, the potency of CAR T cell killing of liquid tumor cell lines can be quantified using the Maestro Z, making it a valuable tool for CAR T cell discovery and manufacturing.
References
- Bishop, D.C., Xu, N., Tse, B., O’Brien, T.A., Gottlieb, D.J., Dolnikov, A., and Micklethwaite, K.P. (2018). PiggyBac-Engineered T Cells Expressing CD19-Specific CARs that Lack IgG1 Fc Spacers Have Potent Activity against B-ALL Xenografts. Mol. Ther. 26, 1883–1895. https://doi.org/10.1016/j.ymthe.2018.05.007.
- Lisby, A.N., Carlson, R.D., Baybutt, T.R., Weindorfer, M., and Snook, A.E. (2022). Evaluation of CAR-T cell cytotoxicity: Real-time impedance-based analysis. In Methods in Cell Biology, (Elsevier), pp. 81–98.
- Pan, K., Farrukh, H., Chittepu, V.C.S.R., Xu, H., Pan, C., and Zhu, Z. (2022). CAR race to cancer immunotherapy: from CAR T, CAR NK to CAR macrophage therapy. J. Exp. Clin. Cancer Res. 41, 119. https://doi.org/10.1186/s13046-022-02327-z.
- Rennert, P.D., Dufort, F.J., Su, L., Sanford, T., Birt, A., Wu, L., Lobb, R.R., and Ambrose, C. (2021). Anti-CD19 CAR T Cells That Secrete a Biparatopic Anti-CLEC12A Bridging Protein Have Potent Activity Against Highly Aggressive Acute Myeloid Leukemia In vitro and In Vivo. Mol. Cancer Ther. 20, 2071–2081. https://doi.org/10.1158/1535-7163.MCT-20-1030.
- Smole, A. (2022). Cancer immunotherapy with CAR T cells: Well-trodden paths and journey along lesser known routes. Radiol. Oncol. 56, 409–419.
- Sung, H., Ferlay, J., Siegel, R.L., Laversanne, M., Soerjomataram, I., Jemal, A., and Bray, F. (2021). Global Cancer Statistics 2020: GLOBOCAN Estimates of Incidence and Mortality Worldwide for 36 Cancers in 185 Countries. CA. Cancer J. Clin. 71, 209–249. https://doi.org/10.3322/caac.21660.
- Wang, K., Wei, G., and Liu, D. (2012). CD19: a biomarker for B cell development, lymphoma diagnosis and therapy. Exp. Hematol. Oncol. 1, 36. https://doi.org/10.1186/2162-3619-1-36.
Authors
Benjamin Streeter, Denise Sullivan, Daniel Millard
Axion BioSystems, Atlanta, GA