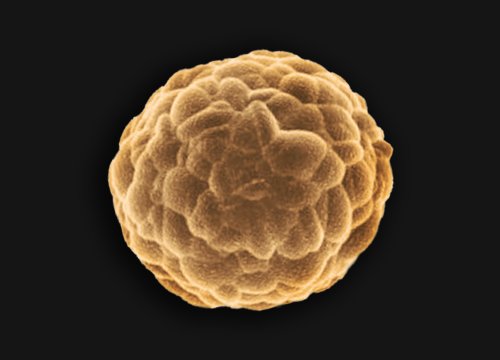
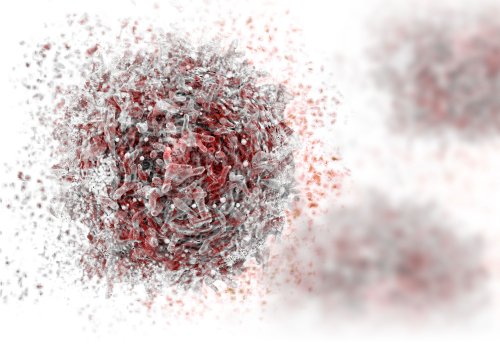
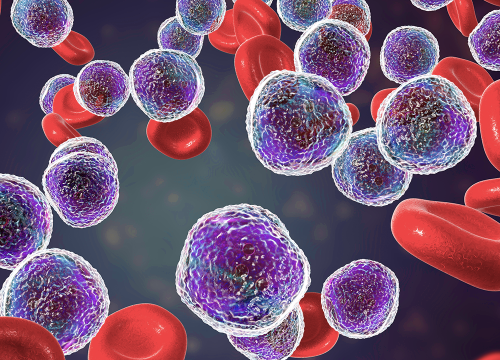
Liquid Tumors
Study hematological cancer models with non-adherent cells to develop the next generation in blood cancer therapies
Learn More→
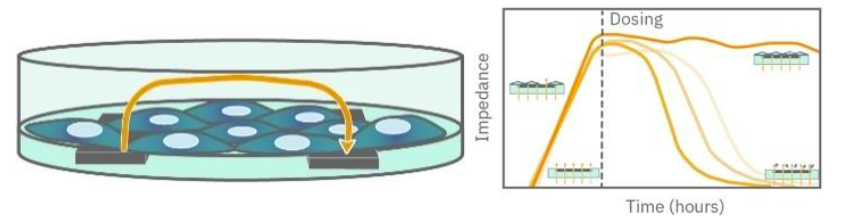
Impedance-based cell analysis is a label-free, real-time technology that monitors live cells by measuring how electrical signals change across microelectrodes embedded in the culture surface. As cells attach, spread, and respond to treatments, the Axion BioSystems' Maestro Z impedance platform provides dynamic, continuous cellular profiles — capturing both baseline behavior and drug- or immune-driven effects.
Traditional assays often rely on dyes, labels, or destructive endpoint measurements, which can interrupt normal biology and miss transient responses. Impedance monitoring solves this by delivering continuous, noninvasive functional readouts — enabling researchers to observe biological change as it happens, particularly in drug discovery, toxicology, and disease modeling.
Continuous, real-time monitoring of live cells without dyes or labels, capturing dynamic behavior over minutes, hours, or days
Sensitive detection of attachment, morphology, barrier formation, and cytotoxicity
Multi-frequency measurements distinguish distinct cell responses and mechanisms
Noninvasive assays preserve biology and enable longitudinal study
Compatible with high-throughput and multiplex experimental workflows

The Maestro Z was incredibly easy to use, and demonstrated sensitive, real-time measurements of brain cancer cell proliferation and T cell cytotoxicity. The product is easy to set up in the laboratory space due to the convenient size and the independence from needing to place it inside an incubator. The software is very user friendly and allows for monitoring results as they occur as well as simple analysis upon completion.
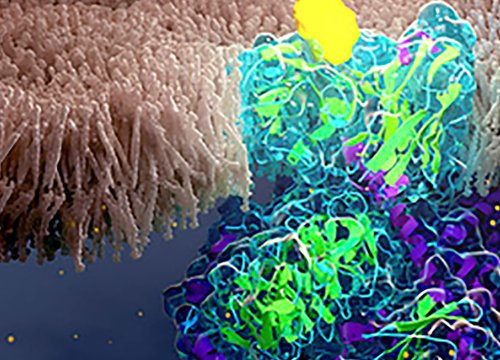
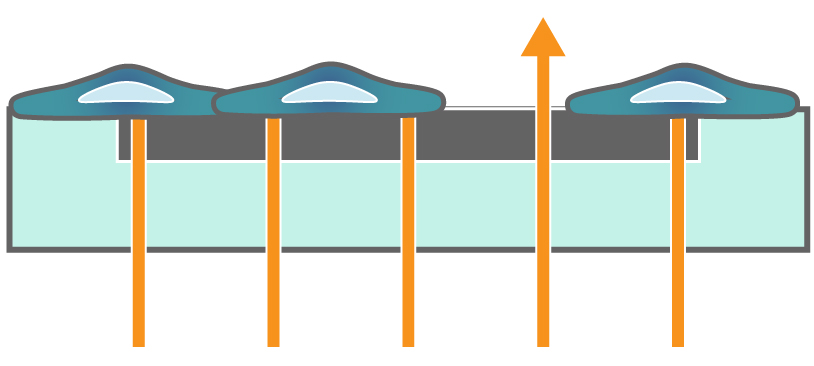
Impedance technology measures how adherent cells alter the flow of low-level electrical current across embedded electrodes.
As cells attach, spread, form junctions, or die, they change impedance in measurable ways — producing a direct functional readout of cell health, morphology, and barrier integrity over time.
Because it is label-free and noninvasive, impedance enables continuous, real-time monitoring of dynamic cell behaviors over extended periods. Multi-frequency measurements and integrated software allow these signals to be translated into robust, high-level assessments of cell health, function, and response to stimuli.
Impedance-based cell analysis relies on the principle that living cells partially block the flow of electrical current when they attach to electrodes. As cells proliferate, they change how easily a small electrical signal passes through the system. These changes are measured as electrical impedance, which directly reflects cellular behavior over time.

Cells are cultured and seeded into electrode-embedded multiwell plates using standard protocols. No labels, dyes, or invasive reagents are required.

The prepared plate is placed into the environmentally controls Maestro Z impedance system, which applies low-level electrical signals across the integrated electrodes.

The system continuously measures changes in electrical impedance as cells attach, grow, form barriers, or respond dynamically to drug or biological treatments.

Impedance signals are translated into quantitative metrics that reflect cell health, morphology, barrier integrity, and functional responses over time.
Explore how real-time impedance monitoring with the Axion BioSystems' Maestro Z platform compares to traditional endpoint methods, and why continuous functional readouts provide deeper insight into live cell behavior.
Maestro Z impedance platforms use continuous, real-time impedance measurements, allowing researchers to monitor live cell behavior dynamically over minutes, hours, or days. Traditional endpoint assays typically provide only a single snapshot in time, often requiring destructive processing steps.
No. Maestro Z impedance assays are label-free and noninvasive, meaning cells remain intact and biology is not disrupted. By contrast, many endpoint assays require fluorescent dyes, staining, or fixation, which can alter or terminate cellular activity.
Impedance captures subtle functional changes using multi-frequency readouts, making it highly sensitive to dynamic processes such as:
Endpoint assays are limited to discrete measurements and may miss transient or early responses.
Yes. Maestro Z systems are compatible with multiwell plate formats, enabling scalable workflows for:
Traditional endpoint assays often vary in throughput and are frequently low- to medium-throughput due to manual processing steps.
Axion BioSystems' Maestro Z platform provides high reproducibility across wells, plates, and experiments, thanks to automated, continuous measurements without staining variability.
Traditional endpoint assays can introduce variability through:
Yes. Because Maestro Z is noninvasive, impedance measurements can be easily combined with additional assays in the same wells, such as:
Endpoint assays are often difficult to multiplex because they require destructive steps or interfering readouts.
Because Maestro Z measures continuously, it can detect:
Endpoint assays cannot resolve these time-dependent behaviors without.
Maestro Z reduces the need for:
This saves time, reagents, and labor while producing richer datasets from a single experiment.
Yes. Maestro Z enables longitudinal monitoring over days to weeks, making it ideal for:
Endpoint assays are often limited to short time windows.
Maestro Z impedance platform supports a wide range of adherent cell models, including:
Maestro Z offers an integrated, scalable platform with: