Key Findings
>> Two methods for measuring prolonged in vitro CAR T killing are demonstrated.
>> Real-time, label-free measurements track immune cell-mediated cytolysis of cancer cells.
>> CAR T cytotoxicity and phenotype are influenced by the method of repeated challenge.
Abstract
T cell exhaustion and persistence are two common hurdles that impede complete tumor eradication in patients. Adoptive cell therapies must exhibit potent tumor killing over a prolonged period in vivo, but most in vitro assays are performed on short timescales. Here, we describe the development of a repeated challenge potency assay, which evaluates immune effector cell-mediated cytotoxicity throughout multiple presentations of tumor cells. Modifications to the assay that focus on the proliferative capacity, or change in potency, of an immune effector cell population are discussed.
Introduction
Although conventional in vitro immunotherapy potency assays (e.g., chromium release assay, MTT assay, LDH assay) can accurately measure CAR T cell specificity and target cell killing, they often fail to measure the kinetics of cytotoxicity over time. In addition, these short-term assays often require high effector to target (E:T) ratios, making it difficult to differentiate between various CAR T products that may be susceptible to exhaustion or reduced potency at lower E:T ratios. 1
T cell exhaustion and persistence are two factors that can impede complete tumor eradication. In vivo tumor cell killing requires T cells (or other effector cell types) to respond to large populations of target cells, often requiring several rounds of T cell killing driven by cell expansion and differentiation. Upon acute antigen stimulation, naive CD8+ T cells differentiate into effector T(Teff) cells that rapidly expand to establish an antigen-specific Teff cell population. Following antigen removal, the majority of Teff cells die, and the few remaining cells become memory T (Tmem) cells. In contrast, persistent antigen stimulation can push CD8+ T cells into an exhausted state characterized by the loss of cytotoxic function and increased expression of inhibitory receptors (e.g., PD-1, TIM-3,LAG-3).2 Thus, in vitro potency assays that can recapitulate conditions of high tumor burden, induce T cell exhaustion, and allow for changes in T cell killing kinetics to be monitored in real-time are essential.
Here we describe two methods to evaluate CAR T cell-mediated cytotoxicity in response to repeated antigen stimulation in vitro, otherwise known as a repeated challenge assay. Briefly, the Target Cell Addition method continuously adds target cells to stimulated CAR T cells, while the Effector Cell Transfer method repeatedly transfers stimulated CAR T cells to newly plated target cells. Real-time measurement of CAR T cell-mediated killing allows for examination of target cell death over days and weeks with a simple in vitro assay. These assays can be combined with other methods, such as flow cytometry, to analyze the CAR T phenotype and provide a clearer picture of CAR T potency in response to repeated challenges with tumor cells.
Materials and Methods
Cells and reagents
SKOV3 cells (Cat. HTB-77) were obtained from ATCC (Manassas, VA). SKOV3 media was composed of McCoy's 5A Medium Modified (ATCC, Cat. 30-2007), 10% FBS (Gibco, Cat. 16000044), and 1% penicillin/streptomycin (Gibco, Cat. 15140122). CAR T cells targeting HER2 (HER2 scFv-4-1BB-CD3ζ, Cat. PM-CAR1070-1M) and CAR T cell media (Cat. PM-CAR2001) were obtained from ProMab Biotechnologies (Richmond, CA).
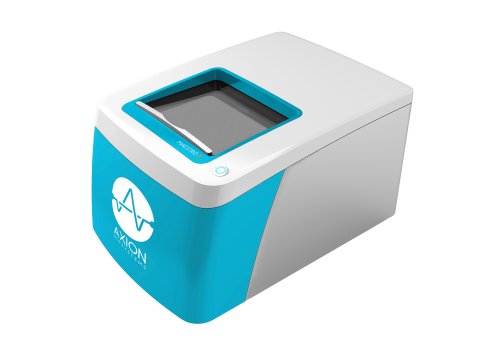
Maestro Z assay platform
The Maestro Z platform (Axion BioSystems) uses impedance measurements (ohms, Ω) to quantify the presence of cells on electrodes embedded in the bottom of the wells of CytoView-Z plates (Axion BioSystems). Cellular impedance is a well-established technique for measuring cell attachment, spreading, proliferation, coupling, membrane integrity (cell death), and subtle changes in cell conformation. Detection is noninvasive and label-free, so it can quantify dynamic cellular responses over minutes, hours, and days. The Maestro Z's built-in environmental chamber finely controls temperature and CO2, ensuring a consistent, optimal experimental environment.
Maestro Z immune cell killing assay
CytoView-Z 96 plates (Axion BioSystems) were coated with 100 µL of fibronectin solution (1µg/mL) per well and incubated at 37°C and 5% CO2 for at least one hour. After incubation, excess surface coating was aspirated from each well. Then 100 µL of SKOV3 medium was added per well and docked on the Maestro Z platform to record a media reference.
SKOV3 cells were thawed and cultured in their respective media according to the supplier recommendations, passaging as needed. Cells were lifted from flasks and dissociated via trypsinization. The cell suspension was then transferred to a 15 mL conical tube and centrifuged at 1,000 rpm for five minutes. The supernatant was aspirated, being careful to not disturb the cell pellet.
The plate was allowed to rest at room temperature for one hour prior to docking on the Maestro Z, which incubated at 37°C and 5% CO2. Integrated humidity reservoirs on the CytoView-Z 96 plates were filled with sterile water to maintain humidity.
To measure CAR T cell-mediated killing, CAR T cells were thawed and cultured according to the supplier recommendations. CAR T cells were maintained in CAR T medium for at least 16 hours prior to addition. At approximately 24 hours post SKOV3 cell plating, CAR T cells were resuspended at 10x the desired final concentration, and then 22 µL of the cell suspension was added at 1:1 E:T ratio. The same volume of media was added to “No Treatment Control” and “Media Only Control” groups. TritonX-100 (1%) was added to “Full Lysis Control” wells.
Repeated challenge assay
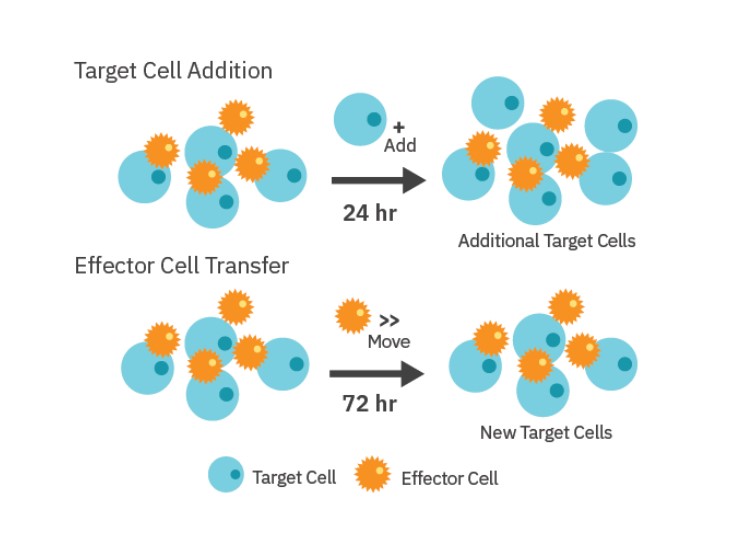
As shown in Figure 1, the repeated stimulation of CAR T cells with SKOV3 cancer cells was performed by two different methods: 1) Target Cell Addition and 2) Effector Cell Transfer. For the Target Cell Addition method, 5,000 SKOV3 cells were added to treatment wells in 10 µL aliquots every 24 hours after they had had been dosed with CAR T cells. “No Treatment Control” wells were also dosed with SKOV3 target cells. SKOV3 addition was performed 5 times during the experiment. A single stimulation control was included in which no SKOV3 cells were added beyond the initial plating.
For the Effector Cell Transfer method, CAR T cells were removed from one plate after 72 hours of killing, counted using a hemocytometer, and then added at a 1:1 E:T ratio to a new plate of freshly plated SKOV3 cells (5,000 cells/well). CAR T transfer was repeated for four rounds of stimulation.
CAR T cell-mediated killing assay
CytoView-Z 96 plates were coated with antibody solution, and all target cell types were thawed and cultured, both in the same manner as described above. Cells were added at 50,000 cells per well in 100 µL. The plate was allowed to rest at room temperature for one hour prior to docking on the Maestro Z, which incubated the plate at 37°C and 5% CO2. Integrated humidity reservoirs on the CytoView-Z 96 were filled with sterile water to maintain humidity. To measure CAR T cellmediated killing of target cells, CD19-targeted CAR (CD19-CAR) T cells were thawed according to the supplier recommendations. At approximately 24 hours post target cell plating, CAR T cells were resuspended at 10x the desired final concentration, and then 22.2 µL of the cell suspension was added at the following E:T ratios: 1:5, 1:2, 1:1, 2:1, and 5:1. CAR T cells at each of these E:T ratios were also added to antibody-coated wells with no target cells (effector-only control wells). The same volume of media was added to “No Treatment Control” and “Media Only Control” groups. Triton X-100 (1%) was added to “Full Lysis Control” wells. The plate was then allowed to rest for 30 minutes at room temperature before again docking onto the Maestro Z. Target cell proliferation and death was then monitored over time on the Maestro Z.
Flow cytometry
A CytoFlex S flow cytometer (Beckman Coulter) was used to acquire flow cytometry data, which was analyzed using FlowJo v10.8 (BD Biosciences). For surface staining, samples were washed with, and stained in, PBS with 1% FBS. For all experiments, known negatives (e.g., unstained or no treatment controls) and single-stained cells served as gating controls. CAR T cells were stained with human CD8a PE antibody (Cat. 12-0088-41, ThermoFisher) and human PD1 Alexa Fluor® 488-conjugated antibody (Cat. FAB7115G, R&D Systems).
Calculation of endpoints
%Cytolysis was used to quantify cell death and was calculated using the following equation:
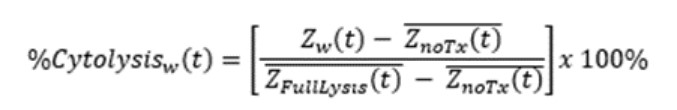
where
ZnoTx(t) is a time series and the mean of the no treatment control wells.
ZFullLysis(t) is a time series and the mean of the full lysis control wells.
%Cytolysis and kill time 50 (KT50) were calculated and exported using the AxIS Z software.
Results
Sequential target cell addition influences total CAR T cell-mediated killing
The Target Cell Addition method was developed to allow for changes in the entire pool of stimulated total effector cells to be monitored.
The attachment and proliferation of untreated SKOV3 cells (Fig. 2A, light grey) were measured via the resistance over time as a negative control. At 24 hours post SKOV3 seeding, CAR T cells were added at a ratio of 1:1.

At 48 hours, 5,000 SKOV3 cells were added every 24 hours for the next 4 days, wells either treated or untreated (Fig. 2A, dark or light orange, respectively) with CAR T cells. The CAR T treatment groups that received repeated stimulation of SKOV3 cells showed reduced cytolysis (Fig. 2B, D) at earlier timepoints (24 to 96 hours). Area under the curve was calculated from the resistance plot and used to measure the total amount of SKOV3 killing over time (Fig. 2C). Both CAR T treatment groups reached 100% cytolysis by 160 hours (Fig. 2D), indicating that the repeatedly stimulated group maintained SKOV3 killing capabilities, despite being exposed to more target cells.
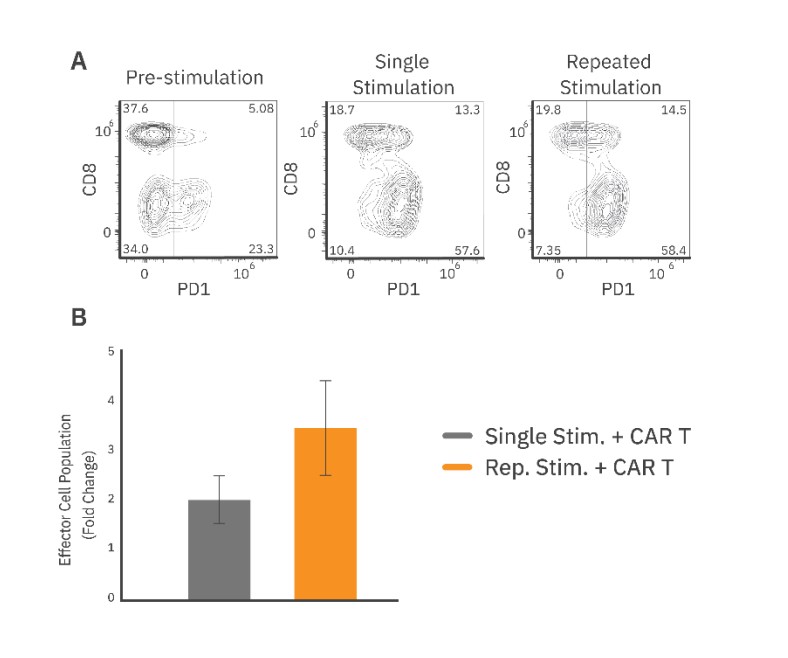
The CAR T phenotype was characterized by measuring CD8 and PD-1 expression with flow cytometry before and after repeated stimulation. Overall, CAR T cells showed a significant increase in PD-1 expression from approximately 27% pre-stimulation to 70% post-stimulation (Fig. 3A).
Furthermore, the population of CD8+/PD1+ CAR T cells increased from 5% to 14.5%. Flow cytometry analysis also revealed that repeated stimulation increased the total effector cell proliferation, as compared to the single stimulation group (Fig. 3B). The proliferative capacity of an effector cell population may be an important indicator of clinical persistence. Thus, a repeated target cell addition assay designed to preserve the effector cell population within the well allows for evaluation of changes in the total CAR T cell population that drives long-term cytotoxicity.
Repeated transfer of CAR T cells results in decreased immune cell-mediated cytolysis
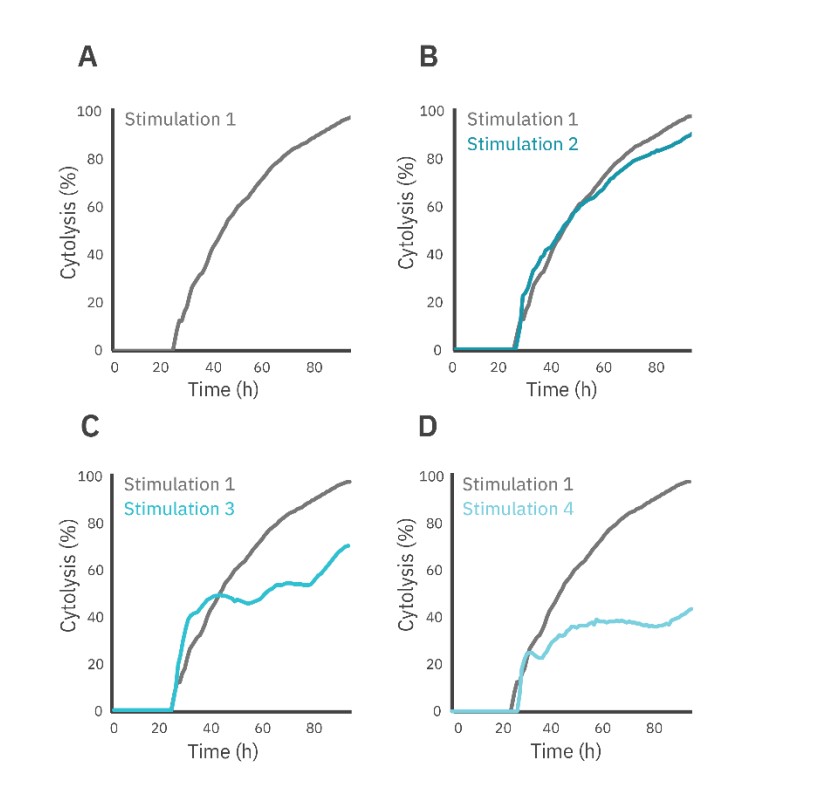
The Effector Cell Transfer method was performed to directly assess changes in effector cell potency over time and across stimulation events. The first round of CAR T stimulation was performed as a standard immune cell killing assay (see methods), with cytolysis of SKOV3 cells evaluated over the first 72 hours (Fig. 4, gray). For each subsequent round of stimulation, the CAR T cells were removed from the plate, counted, and added to a new plate of SKOV3 target cells at a 1:1 E:T ratio for an additional 72 hours (Fig. 4, teal).
The CAR T cell-mediated cytolysis was reported at 72 hours post-dose for each stimulation event (Fig. 5A). Each subsequent round resulted in decreased SKOV3 cell killing when compared to the previous stimulation (Fig. 5A). Furthermore, the KT50 for the first three rounds of stimulation averaged around 20 hours, but by the fourth round of stimulation, the KT50 dramatically increased to over 80 hours.
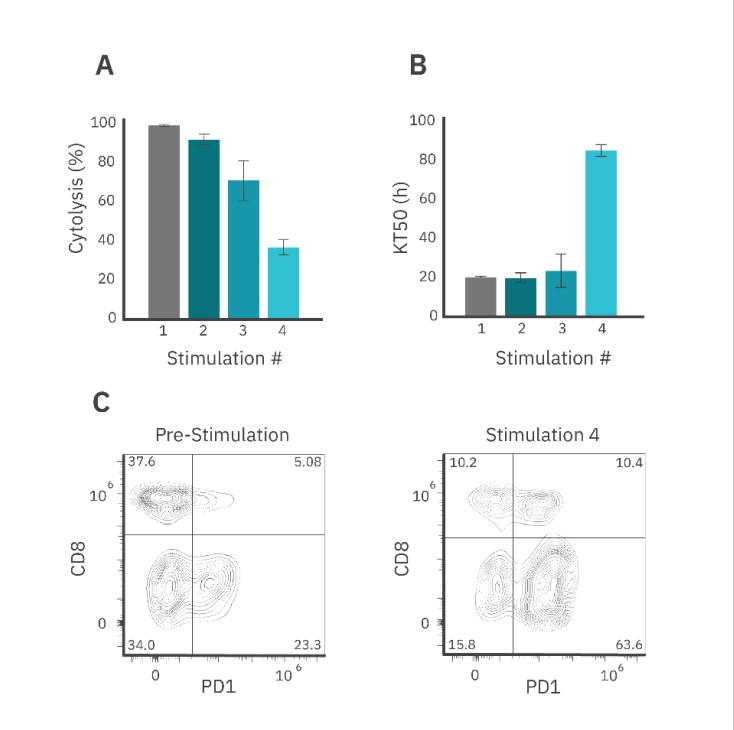
Similar to the Target Cell Addition method, flow cytometry results showed that repeated stimulation increased the proportion of PD-1+ CAR T cells in the population (~74%) as compared to pre-stimulated CAR T cells (~28%) (Fig. 5C). The population of CD8+/PD1+ CAR T cells increased by 5% after 4 rounds of stimulation.
In contrast to the Target Cell Addition, there was a decrease in CD8+ CAR T cells by the fourth round of stimulation (data not shown), indicating that the effector cell population may have shifted toward an exhausted (and less potent) state, potentially leading to effector cell death. In addition, the Effector Cell Transfer method effectively only uses a subset of the total CAR population for target cell killing, and thus may be preferentially transferring whichever T cell phenotype is more abundant. Furthermore, differences in potency may have also been influenced by the E:T ratio.
The Effector Cell Transfer method maintains a 1:1 E:T ratio at the start of each round of stimulation, while the E:T ratio for Target Cell Addition changes with each addition of target cells. Overall, the effector cell transfer method may be better suited for applications interested in comparing long term potency of various CAR T constructs.
Conclusions
Here, we present two different methods (Target Cell Addition and Effector Cell Transfer) to perform a repeated challenge assay with CAR T cells on the Maestro Z platform. Although both methods allow for evaluation of the long-term potency of stimulated CAR T cells, each method provides a unique perspective. Target Cell Addition allows for changes to the total effector cell population to be characterized, while Effector Cell Transfer allows for changes in CAR T potency to be easily examined. By applying the same principles demonstrated in this assay, the persistence of in vitro potency of different CAR constructs may be evaluated over time.
References
- Gattinoni L et al. Acquisition of full effector function in vitro paradoxically impairs the in vivo antitumor efficacy of adoptively transferred CD8+ T cells. J Clin Invest. 2005 Jun;115(6):1616-26.
- Wherry EJ, Kurachi M. Molecular and cellular insights into T cell exhaustion. Nat Rev Immunol. 2015 Aug;15(8):486-99.
Authors
Denise Sullivan & Daniel Millard
Axion BioSystems, Atlanta, GA