Abstract
Comprehensive, high-throughput, in vitro screening of the neurological effects of chemical compounds and drugs is vital for environmental and drug safety. Neurotoxicity can be either functional, disrupting activity and networking, or structural, causing cell death. Historically, functional and structural toxicity have been tested using separate cell-based assays, often limited to single time points. Further, neurotoxicants can exhibit species and cell-type specific effects that vary with dose and timing. Here, we present a comprehensive structure-function assay that combines functional microelectrode array (MEA) activity measures with impedance-based assessment of cell coverage and viability. Because impedance is label-free and non-invasive, activity and viability can be tracked over time without disturbing the biology. Using the Maestro Pro, primary and hiPSC-derived neurons were dosed with varying concentrations of neurotoxic compounds. Functional activity and impedance-based viability were monitored for 6 days. The assay captured cell-type specific and dose-dependent dynamics of neurotoxicity across a range of compounds.
Introduction
Neurotoxicity can involve a range of effects on cell morphology, cell health, network formation, and single neuron or network function. Thus, when screening for neurotoxicity, it is important to capture the neuronal structure and function, on both acute and chronic time scales.
Functional cell-based assays often monitor for changes in neuronal activity with calcium imaging, patch clamp electrophysiology, or label-free microelectrode array (MEA) recordings. For many compounds, activity alone may be insufficient. For example, neuroactive compounds, such as antiepileptics, GABAergics, or some ion channel blockers may cause activity to cease, but may or may not cause cell death. Label- or dye-based cytotoxicity assays, such as Resazurin or Trypan Blue, can be combined with functional assessments, but may be limited to a single time point or confounded by metabolic changes. An assay that could evaluate compound effects on functional activity and structural integrity of neuronal networks, repeatedly over hours or days and in high throughput format, could greatly reduce cost and accelerate efficiency of neurotoxcity screening.
By combining MEA and impedance-based technology, the Maestro Pro and Edge multi-well MEA system now enables assessment of structure and function from the same well in a single assay across a variety of throughputs. To measure cell viability or coverage, a small current is passed through the microelectrodes in the bottom of each well; impedance is then defined by how easily the signal passes through the cell-electrode interface. When more viable cells are covering the electrode, less current can pass through, and the impedance is higher. When cells die, impedance decreases.
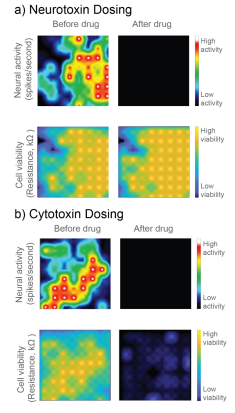
In Figure 1, a neurotoxin that silences activity and a true cytotoxin were applied to a CytoView MEA 6-well plate seeded with hiPSC-derived neurons. Both compounds silence the neural activity, but only the cytotoxin causes significant cell death, as reflected in the reduced resistance. Activity alone cannot distinguish the neurotoxin and cytotoxin, but impedance-based viability measures from the same well clearly differentiate the two.
Here we evaluate the ability to use the Maestro’s impedance technology, called MEA Viability, to monitor the viability of both primary and hiPSC-derived neurons on multi-well MEA plates in response to a range of cytotoxic compounds across multiple days. In addition to detecting cell death, MEA Viability also captured the differing dynamics of cell death across concentrations and cell types.
Materials
Cells and Reagents
Human induced pluripotent stem cell (hiPSC) derived neurons, including glutamatergic excitatory and GABAergic inhibitory neurons and astroglia (cat. 1010-5), were obtained from NeuCyte Labs (San Carlos, CA). Short- and long-term culture media was prepared according to supplier recommendations.
Primary rat cortex neurons (RCN) were obtained from Thermo Scientific (Waltham, MA). Cell culture medium was composed of Neurobasal™ Plus Medium (Thermo, cat. A3582901), B27™ Plus Supplement (50X) (Thermo, cat. A3582801), 125 µL GlutaMAX (Gibco, cat. 35050079), and 1% PenStrep (Gibco, cat. 15140122).
Glutamate (cat. 30377) and ionomycin (cat. 10004974) were obtained from Cayman Chemicals (Ann Arbor, MI), and tributyltin (cat. T50202-5G) was obtained from SigmaAldrich (St. Louis, MO).
Microplate Consumables and Instrumentation
CytoView MEA 48-well plates (Axion BioSystems), containing an array of 16 microelectrodes per well, were used in combination with the Maestro Pro platform for all experiments. The Maestro Pro is a 768 channel multi-well MEA platform. The Maestro Pro was enabled with the Neural and MEA Viability modules to allow monitoring of neural network activity and cell viability from all microelectrodes on the CytoView MEA plates.
Methods
CytoView MEA plate preparation
For hiPSC-derived neurons and astroglia co-culture, the plate was first coated with 70 µL of 0.1% polyethyleneimine (PEI) diluted in borate buffer. After one hour incubation at 37°C and 5% CO2, PEI was aspirated and the plate was washed four times with sterile deionized water and allowed to dry overnight. Next, the plate was coated with 70 µL of laminin (20 µg/ml in PBS). After a one hour incubation, excess surface coating was aspirated from each well prior to cell plating.
For primary RCN culture, the plate was spotted with 5 µL of poly-d-lysine (PDL) and incubated for 1 hour at 37°C and 5% CO2. Excess surface coating was aspirated and the plate was washed four times with sterile deionized water and allowed to dry overnight. Humidity reservoirs on the plate were filled with sterile deionized water to maintain humidity.
Cell Culture
RCNs and hiPSC-derived neurons were thawed and cultured according to the supplier recommendations. Cell density and viability was determined using a hemocytometer and Trypan Blue staining. The cell suspension was transferred to a 15 mL conical tube and centrifuged at 100xg for one minute. The supernatant was aspirated, being careful to not disturb the cell pellet.
RCNs were resuspended at a concentration of 16,000,000 cells/mL. A 5 µL droplet (80k cells/well) of the RCN suspension was spotted over the recording electrode area in each well of a 48-well MEA plate and incubated for one hour at 37°C, 5% CO2. After incubation, 300 µL medium was added to each well and half-media changes were performed every 2-3 days.
The hiPSC-derived neurons were resuspended at a concentration of 135,000 cells/well (70,000 glutamatergic, 30,000 GABAergic, and 35,000 astroglia) and 50 µL of the pooled cell mix was added to each PEI/laminin coated well in a 48-well MEA plate. The seeded plate was incubated overnight at 37°C and 5% CO2. The next day, 250 µL of Short-Term Media was added to each well and half-medium changes were performed every other day. At day 7 post seeding, a half media change was performed with Long-Term media. Half-medium changes were then performed every 3 days.
Monitoring Cell Viability on Microelectrodes with Impedance Based MEA Viability
Traditionally, microelectrodes are used to measure functional electrical activity, such as spiking. By having an array of microelectrodes in each well, synaptic and network function can also be assessed, using metrics describing synchrony and network bursting.
The MEA Viability software module expands the MEA assay to include both functional and structural measures. MEA Viability uses impedance technology to monitor cell viability from the same microelectrodes used to capture electrical activity. MEA Viability is reported as Resistance at 41.5 kHz, a component of impedance that is well correlated with cell density.
Impedance is particularly sensitive to cell membrane integrity and, thus, a drop in impedance (or resistance) most often reflects a disruption to the plasma membrane related to cell death.
Lactase dehydrogenase (LDH) release assay
In contrast to viability assays that measure metabolic activity in cells, impedance-based MEA Viability is particularly sensitive to the structural integrity of cell membranes, similar to traditional lactate dehydrogenase (LDH) and trypan blue exclusion assays. When the cell membrane integrity is disrupted (e.g., lysis, necrosis), impedance decreases and LDH is released. Thus, a CYQUANT LDH Cytotoxicity Assay (ThermoFisher, cat. C20300) was performed for both cell types to validate impedance-based viability measures. In contrast to typical LDH release assays, we measured LDH released from lysed cells remaining at the end of the assay as opposed to LDH released into the media throughout the assay, due to the short half-life of LDH (Brown et al 2017; Frank et al 2017). Thus, wells with little to no cell death showed higher amounts of LDH as opposed to wells treated with cytotoxic compounds. At 72 hours post compound dosing, cells were washed twice with PBS and then lysed with the supplied cell lysis buffer for 45 minutes at 37°C and 5% CO2. After cell lysis, 50 µL of sample was transferred to a 96-well assay plate, mixed with 50 µL of Reaction Mixture, and incubated for 30 minutes at room temperature. Then, 50 µL of Stop Solution was added and the absorbance was measured by a plate reader at 490 nm.
Results
Assessing coverage
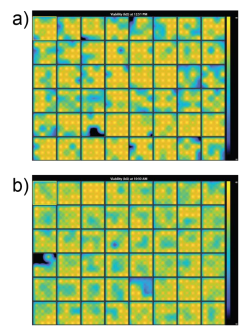
Prior to dosing the cells with compounds, plates were assessed for coverage using MEA Viability. Both CytoView MEA 48-well plates showed high resistance and consistent coverage, with average resistances of 38.6 ± 3.8 kΩ and 35.9 ± 1.9 kΩ for hiPSC-derived and primary neurons, respectively (Figure 2). Covered electrodes were defined as exhibiting a resistance > 18 kOhms. Of the 48 wells on each plate, 44 and 47 wells had at least 15/16 covered electrodes, respectively.
hiPSC-derived neurons exhibited different cell death dynamics depending on compound type and dose
To assess the sensitivity of impedance-based MEA viability to various compounds and time courses, hiPSC-derived neurons were dosed with a variety of compounds.
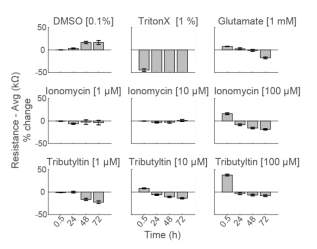
As controls, neurons were dosed with Triton X-100 (1%), a surfactant to fully lyse cell membranes, and DMSO (0.1%), a vehicle control. As expected, DMSO did not change resistance, indicating little to no cell death. Triton X-100 induced over 50% decrease in resistance within 30 minutes of addition, reaching a final resistance of 12.9 ± 0.2 kΩ. This resistance is approximately the resistance of a CytoView microelectrode in media alone and, thus, reflects complete cell death (Figure 3).
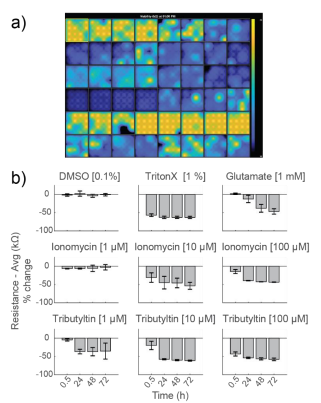
Glutamate, which is excitotoxic at higher doses, induced a slow decay in resistance over 72 hours, with a final resistance of 18.5 ± 3.0 kΩ. Cell death mostly occurred after 24 hours. Previous reports (Diemert et al 2012) indicated an inability to detect delayed glutamate-induced cell death with impedance, but the smaller microelectrodes on CytoView plates likely enable higher sensitivity compared to larger interdigitated electrodes. The final resistance was slightly higher than that seen with Triton X, likely due to residual cell debris.
Ionomycin, an ionophore that impacts intracellular calcium, and Tributyltin, a cytotoxic organotin, both induced faster, dose-dependent decreases in resistance. Most cell death occurred within the first 24 hours.
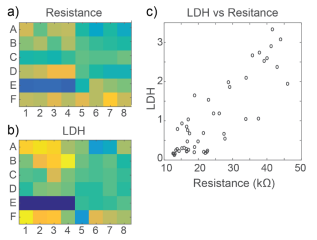
At 72 hours, cell viability was also assessed by an LDH release assay. Total LDH released upon cell lysis was measured to quantify the number of viable cells remaining at 72 hours, as described in Frank et al 2017. Thus, wells with little to no cell death showed higher amounts of LDH as opposed to wells treated with cytotoxic compounds. Results were well correlated between LDH and Resistance on a well-by-well basis, as seen in Figure 4.
Primary neurons exhibit early rise in impedance in response to some cytotoxic compounds
To compare the response across species and cell types, primary RCNs were dosed with the same compounds. DMSO showed no initial change, but an increase in impedance after 48 hours of continuous exposure. As seen with hiPSC-derived neurons, Triton X-100 induced nearly 50% decrease in resistance within 30 minutes of addition, reaching a final resistance of 16.2 ± 0.4 kΩ (Figure 5).
Repeated measurement of impedance-based cell viability revealed differences in the dynamics of cytotoxin-induced cell death between primary neurons and hiPSC-derived neurons. Low doses of ionomycin showed little change in impedance. Interestingly, the highest dose of ionomycin (100 µM), the two higher doses of Tributyltin (10 and 100 µM), and glutamate all showed an early increase in resistance before a subsequent decline. This increase likely reflects apoptosis-related cell swelling or distress that eventually leads to necrotic cell death, as seen in the final decreased resistance (Malik et al 2015; Mitra et al 2013).
Notably, cell death of primary neurons was less prominent in response to the same compounds. These results agree with previous reports indicating that the kinetics and mechanisms of cell death in response to toxins can differ between hiPSC derived and primary neurons, as well as across species (Druwe et al 2015, Malik et al 2015). For example, Malik et al identified ~ 100 compounds with toxicity to neural stem cells and stem cell derived neurons, but not primary rodent cortical neurons, possibly attributable to species or differentiation status.
As with the hiPSC-derived neurons, cell viability was confirmed with an LDH release assay at 72 hours. Viability results were correlated between LDH and Resistance on a well-by-well basis, as seen in Figure 6. With both impedancebased MEA Viability and LDH release, less cell death was observed in primary RCN neurons compared to hiPSCderived neurons for the same compounds.
Conclusion
The Maestro’s impedance-based cell coverage and viability measures were sensitive to cytotoxicity of both hiPSC-derived neurons and primary RCNs and successfully detected cell death across a variety of mechanisms, including excitotoxicity, apoptosis, necrosis, and lysis. Importantly, because impedance is non-invasive and label-free, MEA Viability captured not only the degree but also the dynamics of cell death. As seen here, different cell types, doses, and even cell states can influence the mechanism and dynamics of cell death. Thus, repeated monitoring can be valuable for discerning mechanisms and comparing the dynamics of cytotoxicity across cell types.
Overall, the combination of functional electrophysiological assessment with dynamic monitoring of cell viability in one assay offers a comprehensive and simple cell-based neurotoxicity assay that can detect subtle changes in neuronal function as well as cytotoxicity across a range of mechanisms.