Abstract
High throughput screening requires careful validation of assay performance. Z-prime (Z’), which defines the statistical separation between positive and negative controls in an assay, is a widely accepted metric for assessing assay performance. Higher Z-prime values indicate separation of positive and negative compounds.
Here, we performed a validation study on an impedance-based cytotoxicity assay using the Maestro ZHT platform and CytoView-Z 384-well plates. A549 cells were cultured and treated with mitoxantrone at three concentrations to create “Max”, “Mid”, and “Min” treatment groups. The Z-prime was computed from the “Max” and “Min” treatment groups, corresponding to the lowest and highest concentrations of mitoxantrone, respectively, for each of three independent assays. The Z’ was 0.81 ± 0.03 across the three plates for an HTS assay in duplicate, reflecting high sensitivity and repeatability across plates.
Furthermore, assay performance was characterized spatially across the plate, with no evidence of drift or edge effects. The results presented here support the use of the Maestro ZHT platform for HTS cytotoxicity assays.
Introduction to high throughput screening cytotoxicity assay
The Maestro ZHT platform performs cell-based assays in 96- and 384-well plate formats. Using label-free bioelectronic assay technology, cell viability may be monitored continuously over time within the Maestro ZHT under integrated environmental control. Here, we conducted a validation study for a high throughput screening (HTS) cytotoxicity assay using the Maestro ZHT platform. HTS applications require reliable and consistent endpoints. Z-prime (Z’), a statistical measure of assay performance, quantifies the separation of positive and negative controls within an assay (Zhang et al, 1999). Consensus within the literature suggests that Z’ > 0.5 is recommended for an HTS assay.
Materials
Cells and Reagents
A549 lung adenocarcinoma cells (CCL-185), obtained from ATCC (Manassas, VA) were cultured in T-75 flasks, passaging as necessary. Cells were maintained in complete media consisting of F12K base media supplemented with 10% Fetal Bovine Serum (GeminiBio, Cat. No. 900- 108) and 1% Penicillin/Streptomycin (Gibco, Cat. No. 15140-122). Passaging was conducted using 0.5% Trypsin-EDTA (Gibco, cat. No. 15400-054).
Microplate Consumables and Instrumentation
Axion BioSystems’ CytoView-Z 384-well plates were used in conjunction with the Maestro ZHT platform and the AxIS Z software to monitor impedance in each well. The measured impedance is sensitive to cell attachment, the number and viability of cells, and small changes in cell signaling. In particular, by measuring the resistance at high frequency (41.5 kHz on the Maestro ZHT), the resulting change in resistance from a baseline is proportional to the number of cells present in the well (Hayes et al, 2019). As such, the Maestro ZHT monitors the cell attachment, proliferation, and killing of cells in real-time for the duration of the assay.
Methods
The validation study methods were modeled after HTS assay validation guidelines in the literature (Iversen et al, 2012).
Z-plate Preparation
Three CytoView-Z 384-well plates were coated with 50 µL of fibronectin [1 µg/mL] for 1 hour at 37C on subsequent weeks. Each plate was then drained and filled with 50 µL per well of complete A549 media. Following a 2-minute centrifugation at 200 x g, 8 mL of sterile diH2O was added to the built-in humidity reservoirs of each plate. Each CytoView-Z 384-well plate was docked in a Maestro ZHT system and the media-only baseline was measured in the AxIS Z software. The plate was then ejected and transferred to a biosafety cabinet for cell addition. A549 cells were added to each well, at 3,333 cells per well in 25 µL of media, for a total well volume of 75 µL. The plate remained in the biosafety cabinet for 1 hr after cell addition to prevent edge effects (Lundholt et al, 2003), and then was docked in the Maestro ZHT system for continuous monitoring.
Compound Treatment
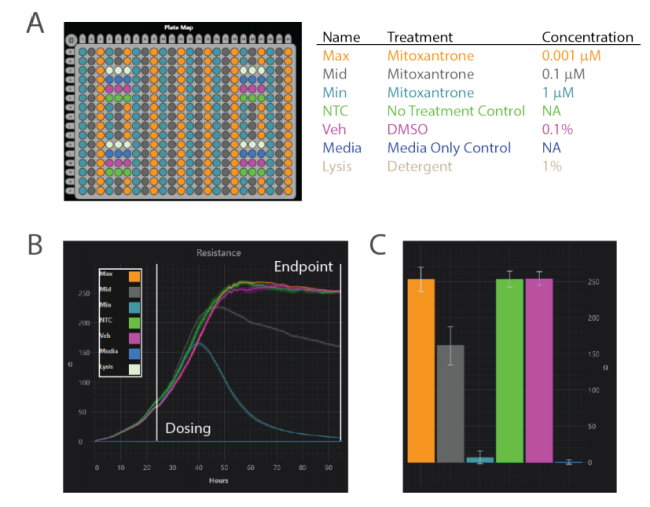
At 24 hours post cell addition, a multi-well compound dosing plate was prepared. Mitoxantrone (Cayman Chemical, 14842) was chosen as the positive control for the study. Appropriate drug doses were determined in a previous concentration sweep experiment (data not shown). Mitoxantrone concentrations of 1 µM, 0.1 µM, and 0.001 µM were selected, representing Minimum Signal (Min), Medium Signal (Mid), and Maximum Signal (Max), respectively. The doses were applied as 8.3 µL additions in alternating columns with each plate representing a shifted pattern of Max-Mid-Min, Mid-Min-Max, and Min-Max-Mid on subsequent plates. Controls of lysis buffer (Lysis), DMSO (Veh), no treatment control (NTC), and media only wells (Media) were applied in 4 equally spaced replicate groups around the plate. Impedance was tracked continuously for 72 hours post-treatment. Microscope images were taken of example wells for each treatment condition.
Data Analysis
Resistance at 41.5kHz was tracked for 96 hours (72 hours post-treatment) at 1 sample/min. The Media control group was used as the background control, such that the average impedance of the media group was subtracted from all wells at each time point. No additional normalization or processing was performed on the raw data. At 96 hours, the data, labeled by treatment group and organized by well number, was exported from AxIS Z for all additional computations. Outlier removal was performed by identification and removal of data points that were greater than 3 standard deviations from the mean within a treatment group.
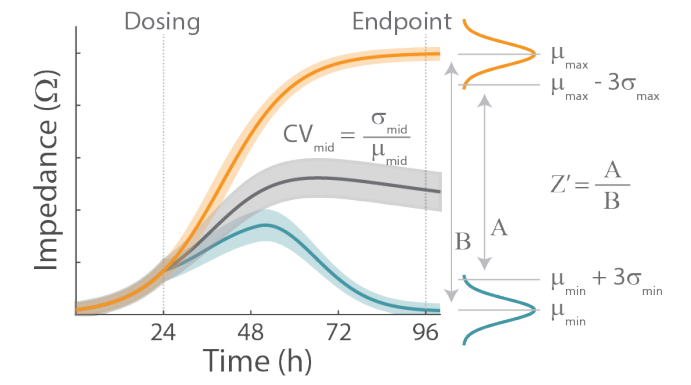
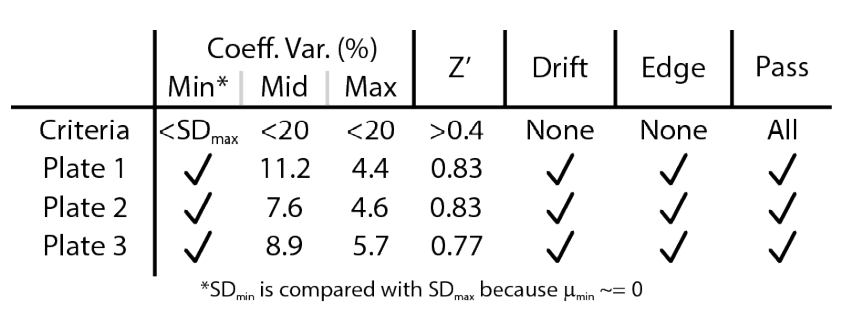
The coefficient of variation and Z’ were calculated according to methods described in the literature (Iversen et al, 2012) and as depicted in Figure 1. The computation of Z’, was evaluated for a reasonable range of replicates, 𝑛𝑛, where 𝜇𝜇 and 𝜎𝜎 represent the mean and standard deviation, respectively, for a given treatment condition. Similarly, the coefficient of variation for each treatment condition was calculated as:
Lastly, the data was plotted as (1) wells in order by row then column (i.e. A1, A2…P23, P24), and (2) wells in order by column then row (i.e. A1, B1…O24, P24). These plots allow easy visualization of two features that must be taken into account for any HTS assay: drift and edge effects. Drift is a consistent change in measurement across a microplate, such as higher measurements on the left side of the plate, compared to the right side of the plate. Edge effects are specific to differences in measurement at the boundaries of the microplate, compared to the inner wells.
- The validation study was evaluated against HTS acceptance criteria published in the literature (Iversen et al, 2012) and detailed below:
- No more than 2% of wells on a plate should be declared outliers.
- Z’ should be greater than 0.4.
- The calculated CVs should all be 20% or less to demonstrate consistency within a treatment group.
- If the “Min” treatment group has a mean near zero, the standard deviation is instead required to be less than the standard deviation of the “Max” condition.
- No apparent drift or edge effects observed. This is evaluated quantitively through the CV < 20% criteria, but should be inspected manually as well.
Results
HTS Validation for Impedance-based Cytotoxicity Assay
An example data set is depicted in Figure 2, for which the impedance was tracked continuously over 96 hours. After monitoring A549 cell attachment and proliferation for 24 hours, the treatments were added according to the plate map presented in Figure 2A. The Maestro ZHT continuously monitored resistance for 72 hours post-dose to capture both the degree and kinetics of cytolysis across mitoxantrone doses. Within 24 hours of the dose, the highest concentration of the drug began to kill the cells (Figure 2B). At 96 hours, there was no difference between the Max condition and the NTC and Vehicle control groups (Figure 2C). In contrast, the Min condition approached the Media control group, which served as the background. As expected, the Mid treatment group exhibited a resistance between the Min and Max conditions.
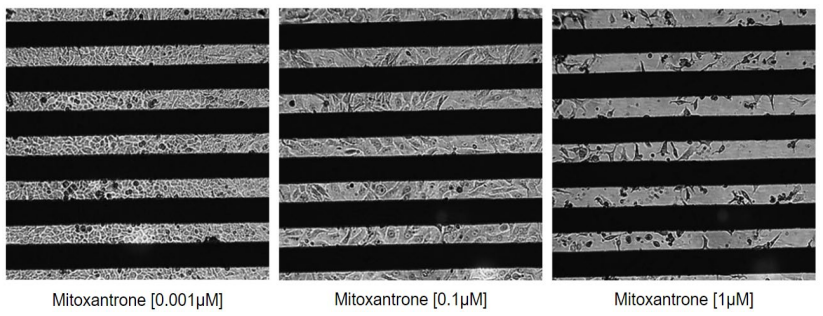
Mitoxantrone is a topoisomerase II inhibitor, an enzyme required to relieve coiling in the DNA during the replication process. Depending on the dose, the drug can cause full cell cycle arrest and cell death. Figure 3 shows representative images from mitoxantrone-treated groups, and the results are consistent with the resistance measurements on the ZHT. The lowest concentration showed a comparable resistance to the vehicle and no treatment controls, and visually the cells are in a healthy, confluent monolayer. As expected, the medium concentration triggered cell cycle arrest, as evidenced by the larger cell size and fewer overall cells in the well. The highest cytotoxic concentration demonstrated few living cells present in those wells. The dark color of the cells resulted from uptake of the mitoxantrone compound itself, which has a blue tinge. This confirmed that the cells had taken up the compound, and were being killed.
Impedance Assay Meets HTS Acceptance Criteria
All plates exhibited very few outliers (7, 4, and 3 wells, respectively, for an average of 4.6 ± 2 wells per plate), below the acceptance criteria of 8 wells (Iversen et al, 2012). As shown in Table 1, CV values for each treatment group fell under the 20% threshold, with the exception of the minimum signal. The minimum signal average was near zero, and, as such, the CV criteria could not be successfully applied. Thus, the standard deviation of the Min signal was compared to the standard deviation of the Max signal, as described in the Methods and literature (Iversen et al, 2012). Each plate passed the outlier and reliability criteria.
The goal of this work was to evaluate the HTS performance of the Maestro ZHT platform and CytoView-Z 384-well plate by computing the Z’ of the assay. Table 1 also includes the Z’ calculated for each plate, assuming 𝑛𝑛 = 2 replicates (see Methods), to maximize the number of conditions per plate. Z’ between 0.5 and 1 is considered an excellent assay, as the separation between Max and Min signals affords high sensitivity and reliability, with low risk of false positives or negatives. Each of the three plates well exceeded Z’ of 0.5, with the average performance of Z’ = 0.81 ± 0.03.
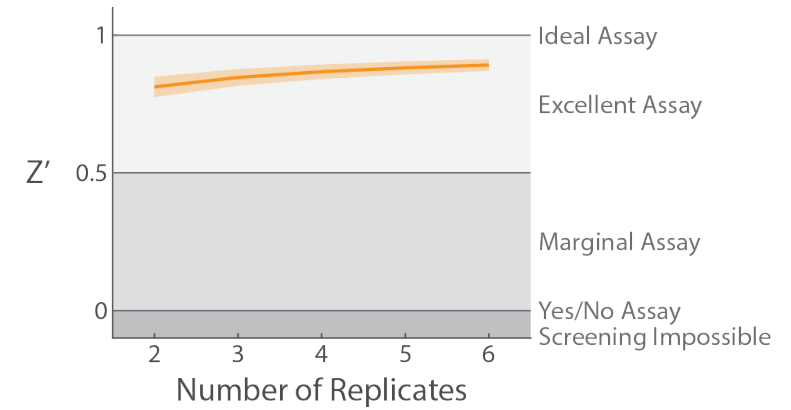
To investigate how Z’ prime is affected by changes to 𝑛𝑛, the calculation was performed for a range of 2 to 6 replicates. The results can be seen in Figure 4, representing an average and standard deviation of Z’ measures from all three plates studied in this assay. There was a diminishing return as 𝑛𝑛 increased, suggesting that increasing the number of replicates above 4-5 is unlikely to further improve upon the excellent assay quality seen with only 2 replicates.
Spatial Uniformity Across CytoView-Z 384-well Plate
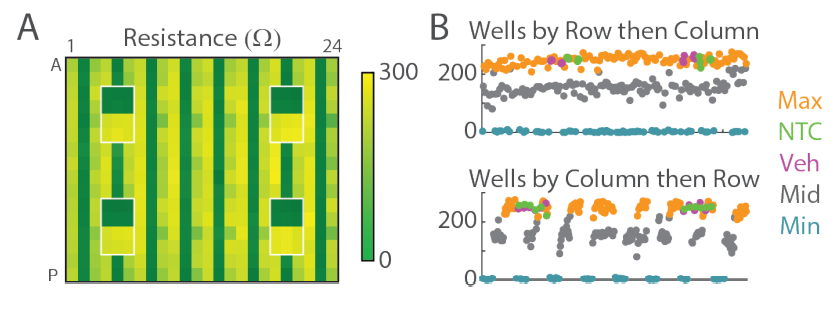
The heat map in Figure 5A shows the resistance as measured at 41.5 kHz at 96 hours (green represents background, yellow represents high resistance). The control wells, initially discussed and identified in Figure 2, are highlighted in white, and can be easily distinguished from the mitoxantrone treated wells on the remainder of the plate. The NTC and Veh wells show maximum signal (yellow) as the A549 cells continue to create a high resistance, confluent layer in those wells. The Media wells show minimum signal (green), representing little to no signal above background. No significant drift (e.g. from left to right) or edge effect (e.g., deviation of outer row/column) was observed. In Figure 5B, the individual well data was plotted against position on the plate. No consistent spatial pattern was noted.
Discussion
A validation study was performed using the A549 cell line and CytoView-Z 384-well plates on the Maestro ZHT to evaluate the Z’ for an HTS cytotoxicity assay. Mitoxantrone was used as the positive control compound to induce cytotoxicity.
“Min”, “Mid”, and “Max” signal conditions were modeled with varying concentrations of Mitoxantrone to measure the Z’ of the assay (Iversen et al, 2012). The Z’ of 0.81 categorized the Maestro ZHT as an excellent assay, with sufficient sensitivity and repeatability to support HTS applications.
Spatial uniformity across a microplate is also highly desirable, but not always achievable. In general, edge effects and drift exist across the screening domain due to nonuniform temperatures within incubators, evaporation differences between internal and edge wells, instrumentation temperature variability, and a variety of other sources irrespective of user and other system sources of error. With screening applications in mind, the Maestro ZHT platform has built-in environment controls to maintain a consistent environment (e.g., temperature and CO2), supported by the uniform assay measurements presented in this study.
In conclusion, the validation study results support an impedance-based cytotoxicity assay with CytoView-Z 384-well plates on the Maestro ZHT for HTS applications.
References
[1] Zhang, Chung, and Oldenburg. “A simple statistical parameter for use in evaluation and validation of high throughput screening assays.” J. Biomol. Screen. 4, (1999): 67–73.
[2] Hayes, et al. “Validation of the Maestro impedance assay for real-time cell counting.” Axion Biosystems Website (2019).
[3] Iversen, Philip, et al. "HTS Assay Validation; Assay Guidance Manual." Bethesda (MD): Eli Lilly & Company and the National Center for Advancing Translational Sciences (2012).
[4] Lundholt, Scudder, and Pagliaro. "A simple technique for reducing edge effect in cell-based assays." J. Biomol. Screen. 8.5 (2003): 566-570.