Key Findings
>> Growth of cancer spheroids are tracked with the Maestro Z.
>> Immune-cell mediated cytolysis of 3D cancer spheroids is quantified in real time.
Abstract
The solid tumor microenvironment poses a significant challenge to immune therapies like CAR T cells. The development of three dimensional (3D) in vitro models, like cancer spheroids or tumoroids, may provide a more accurate representation of immune cell killing of solid tumors. Here we demonstrate a real-time, label-free potency assay to evaluate CAR T cell-mediated cytotoxicity of 3D cancer spheroids. The growth of SKOV3 cancer spheroids was monitored using the Maestro Z platform and the immune cell-mediated killing of HER2-targeted CAR T cells is compared between spheroid and monolayer cultures.
Introduction
The field of cancer immunotherapy aims to harness the body's immune system to fight cancer. For example, chimeric antigen receptors (CARs) engineered into autologous T lymphocytes enable the detection and elimination of cancer tumor cells (Rafiq et al., 2020). In addition, the adoptive transfer of CAR T cells has demonstrated remarkable success in treating certain liquid tumors, namely CD19+ B cell lymphoma and acute lymphoblastic leukemia, leading to FDA approval for these indications. Following these successes, programs to advance CAR T cell technology have aimed to improve the safety and efficacy of the treatment and broaden the types of cancer that may be targeted.
Solid tumors have proven more challenging to target with CAR T cell treatments. In many cases, antigens with high specificity have not been identified for solid tumor indications. Furthermore, solid tumors are characterized by a harsh tumor microenvironment (TME) that can influence the interaction between the tumor and cell therapy. The TME may act as a physical barrier, preventing immune cells from entering the tumor, or may contain immune-suppressive factors, such as programmed cell death 1 ligand 1 (PD-L1) or hypoxia (for review, see Labani-Motlagh et al., 2020). Modeling the TME in vitro using 3D cancer spheroids may improve the predictive value of potency assays in evaluating candidate immune cell products.
Potency assays directly measure the killing potential of effector cells by quantifying target cell viability and have traditionally used two-dimensional (2D) cancer cell cultures (Kiesgen et al., 2021). Three-dimensional cancer models have been shown to more closely mimic the TME found in the human body than traditional 2D culture (Boucherit et al., 2020). Typically, these 3D models have uniform cellular composition, either with simple architecture (e.g., spheroids) or undefined shapes (e.g., aggregates). More complex structures, such as tumor organoids, or tumoroids, made from cancer stem cells or tissue are also being explored.
In this study, the Maestro Z was used to develop a real-time, label-free potency assay for immune-cell mediated killing of 3D cancer spheroids. First, we characterized the formation, attachment, spreading, and growth of cancer spheroids in 96- and 384-well CytoView-Z plates. Then, we quantified the cytolysis of cancer spheroids in response to HER2-targeted CAR T cells. Finally, CAR T cell-mediated cytolysis was compared between 2D and 3D cancer models.
Materials and Methods
Cells and reagents
SKOV3 cells (Cat. HTB-77) were obtained from ATCC (Manassas, VA). SKOV3 media was composed of McCoy's SA Medium Modified (ATCC, Cat. 30-2007), 10% FBS (Gibco, Cat. 16000044), and 1 % penicillin/streptomycin (Gibco, Cat. 15140122). Fibronectin solution was obtained from Gibco (Cat. 33016015, 1µg/ml).
CAR T cells targeting HER2 (HER2 scFv-4-1BB-CD3~, Cat. PM-CAR1070-1M) and CAR T cell media (Cat. PMCAR2001) were obtained from ProMAB Biotechnologies (Richmond, CA).
Maestro ZHT assay platform
The Maestro ZHT platform (Axion Biosystems) uses impedance measurements (ohms, O) to quantify the presence of cells on electrodes embedded in the bottom of the wells of CytoView-Z plates (Axion Biosystems). Cellular impedance is a well-established technique for measuring cell attachment, spreading, proliferation, coupling, membrane integrity (cell death), and subtle changes in cell conformation . Detection is noninvasive and label-free; it can quantify dynamic cellular responses over minutes, hours, and days. The Maestro ZHT's built-in environmental chamber finely controls temperature and CO2, ensuring a consistent, optimal experimental environment.
Cancer spheroid formation
Ovarian cancer cells (SKOV3) were thawed and cultured according to the supplier's recommendations. Cells were lifted from flasks and dissociated via trypsinization. The cell suspension was then transferred to a 15 ml conical tube and centrifuged at 200 x g for five minutes. The supernatant was aspirated, being careful not to disturb the cell pellet. Cell density and viability were determined using a hemocytometer and trypan blue staining. SKOV3 cancer cells were passaged and resuspended at 5,000, 25,000, 50,000, and 100,000 cells per ml. Ultra-low attachment U-bottom plates received 200 µl of each cell suspension per well (1k, 5k, 10k, and 20k cells per spheroid). The U-bottom plates were centrifuged at 200 x g for five minutes and then placed in an incubator at 37°C and 5% CO2 for four days (Fig. 1).
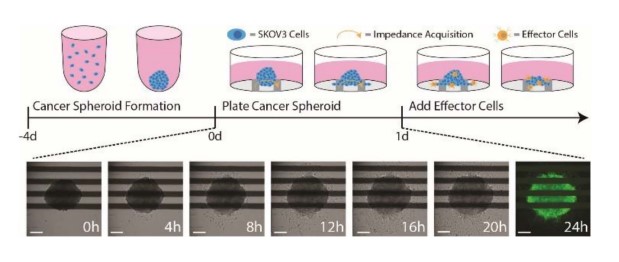
Figure 1: An illustration of the cancer spheroid immunotherapy potency assay. (Top) SKOV3 spheroids are formed and cultured in U-bottom plates for 4 days prior to plating. At 24 hours post target cell plating, effector cells are added to measure immune cell-mediated cytotoxicity. (Bottom) Time-lapse brightfield images of a SKOV3 spheroid seeded in a CytoView-Z plate. At 24 hours, spheroids were stained with F-actin and imaged with the CytoSMART Lux3 FL. Scale bar is 200 µm.
Cancer spheroid growth assay
After four days of spheroid formation, CytoView-Z 96 and CytoView-Z 384 plates wells were coated with 100 and 50 µl of fibronectin solution, respectively. Then, the plates were incubated at 37°C and 5% CO2 for at least one hour. After incubation, excess surface coating was aspirated from each well, then replaced with either 100 or 50 µl of media per well. A media reference measurement was acquired from both plates. For the CytoView-Z 384 plates, the media was aspirated from each well prior to cell plating.
Using a P-1000 pipette with wide bore tips, 100 µl of media with one SKOV3 spheroid was transferred from each well of the U-bottom plates into each well of the CytoView-Z 96 and CytoView-Z 384 plates (Fig. 1). To maintain humidity, integrated humidity reservoirs were filled with sterile water. The plates were allowed to rest at room temperature for one hour before docking on the Maestro Z.
CAR T cell-mediated cytotoxicity assay
To measure CAR T cell-mediated killing, CAR T cells were thawed and cultured according to the supplier recommendations. CAR T cells were maintained in CAR T medium for at least 16 hours prior to addition. At approximately 24 hours post spheroid plating, CAR T cells were resuspended at 10x the desired final concentration, and then 22 µL of the cell suspension was added at various effector to target (E:T) ratios (Fig. 1). To ensure accurate E:T ratios a representative sample of SKOV3 spheroids were counted at the time of transfer from the U-bottom plate to the CytoView-Z plate. The same volume of media was added to positive and negative controls groups. Triton X-100 (1%) was added to full lysis control wells.
Immunostaining
Spheroids were fixed with a 4% paraformaldehyde (PFA) in PBS solution for 20 minutes, followed by three PBS washes. After fixation, the spheroids were permeabilized with 0.1 % Triton X-100 for 20 minutes, followed by three PBS washes. Next, the spheroids were stained with Alexa Fluor 488 Phalloidin (ThermoFisher, Cat. A12379) at a 400x dilution for 45 minutes. Fluorescent images of spheroids were taken using the Axion BioSystems Lux3 FL.
Calculation of cytolysis
%Cytolysis was used to quantify cell death and was calculated using the following equation:
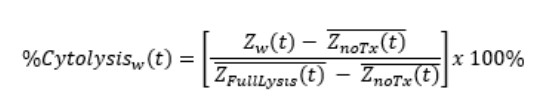
Znarx(t is a time series and the mean of the no treatment control wells.
ZFullLysis(t is a time series and the mean of the full lysis control wells.
%Cytolysis and 50% kill time (KT50) were calculated and exported using AxIS Z software.
Curve fitting and EC50 estimation
The cytolysis EC50E:T ratio was calculated by the AxIS Z software. The Hill equation was fit to cytolysis data taken at the end of the experiment, %Cytolysisw(E/T), such that:
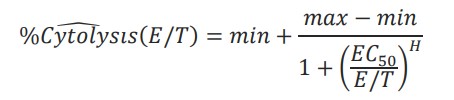
Where min, max EC50, and H were unconstrained parameters and E/T was a reduced form of the E:T ratio.
Results
Cancer spheroid size and growth can be tracked
To demonstrate the ability to track the size and growth of cancer spheroids, SKOV3 spheroids were seeded in CytoView-Z 96 (Fig. 2A) and CytoView-Z 384 (Fig. 2D) plates. As the spheroids attached and grew, resistance increased (Fig. 2B and E), with larger spheroids correlating to a higher resistance (Fig. 2C and F).
/p>
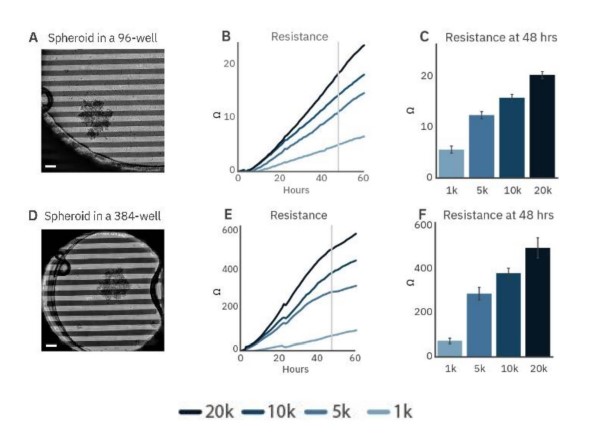
Figure 2: Cancer spheroid growth tracked over time. Spheroids are labeled according to the initial seeding density during formation. Images of 5k SKOV3 spheroids plated on a CytoView-Z 96-well plate (A) and a CytoView-Z 384-well plate (D) immediately after plating. Scale bar is 200 µm. Time course of growth for spheroid of different initial sizes on CytoView-Z 96 (B) and CytoView-Z 384 (E) plates as measured by resistance. At 48 hours post-plating, spheroid size was positively correlated with resistance.
Higher resistance was observed in the CytoView-Z 384 plate. The recording area in a 96-well plate is larger than a 384-well plate so a spheroid covers a smaller proportion of the well (Fig. 4A and B). As a result, spheroids will produce a greater resistance in the smaller well, making the CytoView-Z 384 more suitable for harder-to-detect, smaller spheroids while the CytoView-Z 96 can accommodate larger spheroids or organoids. The label-free measurement of spheroid growth provides a reliable means to model and track tumor size in vitro.
CAR T cell-mediated cytotoxicity of cancer spheroids is quantified in real time
Immune cell-mediated killing against a 3D target was measured by applying HER2-targeted CAR T cells to SKOV3 spheroids. Continued spheroid growth was observed in the no treatment control group by the steady increase in resistance. At 20 hours post-plating, CAR T cells were added at E:T ratios of 1:2 or 5:2. SKOV3 spheroid groups dosed with CAR T displayed dose-dependent cytolysis (Fig. 3B).
Higher ratios of CAR T contributed to higher cytolysis percentages. For example, the 1:2 CAR T group showed steady killing, indicated by steady cytolysis over time, whereas the 5:2 CAR T group showed a higher rate of cytolysis, especially in the first hours after CAR T addition. Only the 5:2 CAR T group reached 50% cytolysis, achieving a KT50 of 35 hours.
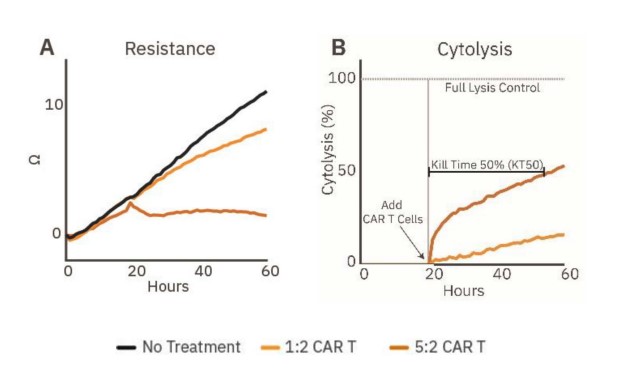
Figure 3: Cytolysis of cancer spheroids can be tracked in real time. (A) Resistance over time of untreated spheroids (gray) and spheroids treated with HER2-specific CAR T cells (orange, n=5). (B) Cytolysis over time of the CAR T treated SKOV3 spheroids (n=5), illustrating dose-dependent cancer spheroid cytotoxicity and KT50.
CAR T-mediated cytotoxicity was lower in cancer spheroids relative to monolayer cultures
To demonstrate the challenge solid tumors present to immune cell therapies, immune cell-mediated cytolysis of SKOV3 spheroids and monolayer cultures by HER2- targeted CAR T cells was compared. The SKOV3 spheroids and monolayer cultures were seeded in a CytoView-Z plate, and the growth was monitored. CAR T effector cells were added at fi ve E:T ratios (1:10, 1:5, 1:2, 1:1, and 5:1) 24 hours after plating the target cells. CAR T cells in the monolayer groups (Fig. 4, teal) showed more cytolysis compared to their respective spheroid groups for the same E:T ratios (Fig. 4A). For example, the monolayer 5:1 group reached full lysis (100% cytolysis) faster than the spheroid 5:1 group. Cytolysis was compared at 72 hours post-addition of the CAR T effector cells (Fig. 48), and the ECso was quantified via a dose-response regression (see Methods). The ECso E:T ratio of the HER2-specific CAR T cells was 1:3 for the mono layer target cells and 1:1 for the spheroid target cells. These results indicate a higher ratio of HER2-targeted CAR T cells is needed for equivalent cell killing against a 3D tumor model in vitro
CAR T potency was also evaluated via KT50, a measure of the kinetics of immune cell-mediated killing (Fig. 4C). Monolayer groups had shorter KT50s than the matched spheroid groups.
These results show that CAR T cells are less effective at killing spheroids compared to monolayers, suggesting that the biology represented by 3D in vitro models may offer a more analogous representation of the complex tumor microenvironment observed in solid tumors in vivo.
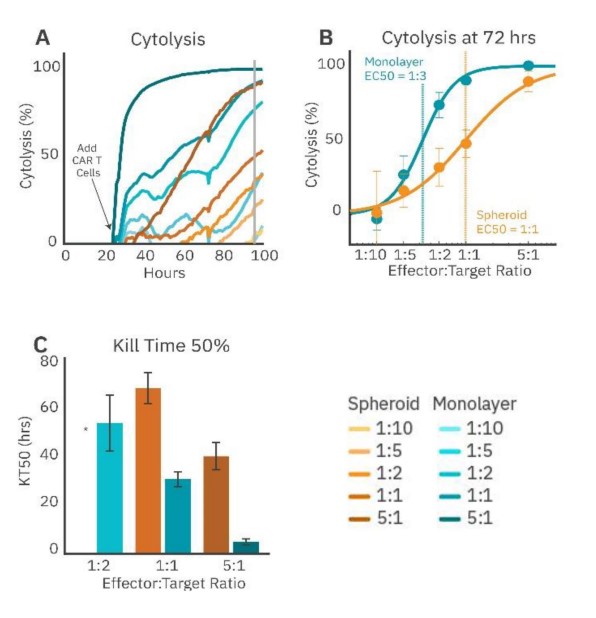
Figure 4: CAR T cell-mediated cytolysis is lower in cancer spheroids than monolayer cultures. (A) Cytolysis over time of SKOV3 spheroids and monolayers treated with 4-1BB (HER2-targeted) CAR T cells at effector-target ratios of 1:10, 1:5, 1:2, 1:1, and 5:1. (B) %Cytolysis of spheroids and monolayers at 72 hours by effector to target ratio. EC50 measured the E:T ratio required to achieve 50% cytolysis. (C) KT50 between spheroids and monolayer groups, displaying dose dependance for both groups and differences in duration to achieve 50% cytolysis between groups.* 1:2 spheroid group did not reach 50% cytolysis
Conclusion
The Maestro Z allows for a simple evaluation of in vitro tumor growth and death in cancer spheroids. The assay was sensitive enough to distinguish spheroids of various cell densities and sizes while continuous, noninvasive measurements tracked growth. CAR T cell-mediated killing was demonstrated across different effector-target ratios, illustrating the ability of the Maestro Z to evaluate and characterize immunotherapies against 3D cancer models in vitro. A reduction in cytolysis was observed in cancer spheroids relative to the 2D monolayer cultures. This may be due to the 3D model's ability to recapitulate aspects of solid tumor biology.
References
- Rafiq, S., Hackett, C. S. & Brentjens, R. J. Engineering strategies to overcome the current roadblocks in CAR T cell therapy. Nat. Rev. Clin. Oncol.17, 147-167 (2020).
- Labini-Motlagh, A., Ashja-Mahdavi, M. & Loskog, A. The Tumor Microenvironment: A Milieu Hindering and Obstructing Antitumor Immune Responses. Front. Immunol. 11, 1-22 (2020).
- Kiesgen, S., Messinger, J. C., Chintala, N. K., Tano, Z. & Adusumilli, P. S. Comparative analysis of assays to measure CAR T-ce/1-mediated cytotoxicity. Nat. Protoc. 16, 1331-1342 (2021).
- Boucherit, N., Gorvel, L. & Olive, D. 3D Tumor Models and Their Use for the Testing of Immunotherapies. Front. Immunol. 11, 1-10 (2020).
Authors
Omari Weems, Denise Sullivan, Daniel Millard
Axion BioSystems, Atlanta, GA