Cell proliferation is characterized by cell growth and division, resulting in an exponential increase in total cell number and tissue growth. Various factors, such as culture conditions, the addition of drugs, or infection, can either promote or inhibit cell growth and viability, and the study of these factors represents an important area of drug discovery, cancer, and neurological disease research.
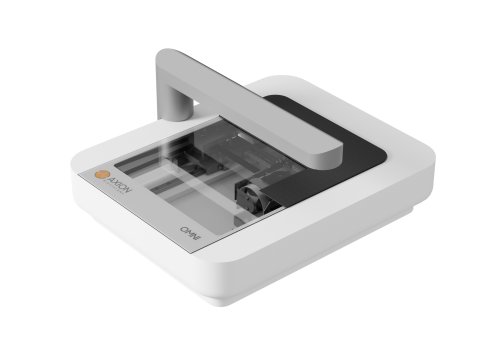
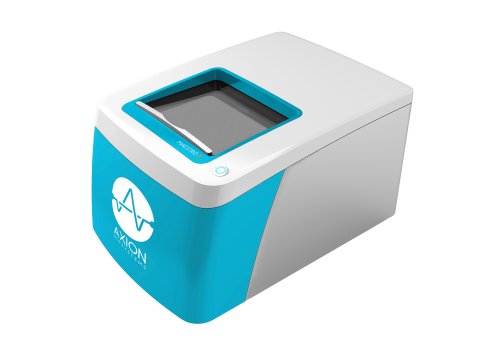
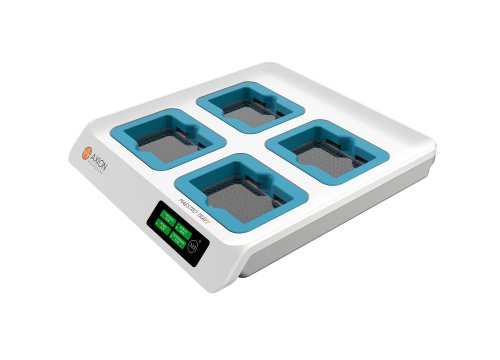
Axion BioSystems’ platforms offer real-time, continuous, label-free monitoring of your cells directly inside the incubator. Live-cell imaging and impedance-based analyses measure cell proliferation and viability without the time- and cost-intensive process of repeating multiple endpoint assays.
Cell Proliferation Analysis
Cell proliferation can be subdivided into:
- Lag phase – adaption of cells to the new environment; biosynthesis and preparation for rapid division
- Log phase – rapid and exponential growth of cells
- Stationary phase – cell growth slows down and reaches a plateau; depletion of nutrients and accumulation of waste
Axion's live-cell analysis and imaging platforms make it easy to track and analyze growth kinetics in real time, with no labels or costly reagents.

Real-Time Cell Proliferation and Viability Assays
-
Improve accuracy using whole-well analysis of cell confluency>
-
Determine optimal seeding density for different cell types>
-
Compare proliferation profiles of different cell lines >
-
Monitor iPSC growth for optimal passaging>
Purpose: To measure cell proliferation across multiple wells of a 24-well plate. As cells don’t always plate evenly, it is important to visualize an entire well to ensure accurate and reproducible analysis of cell confluency.
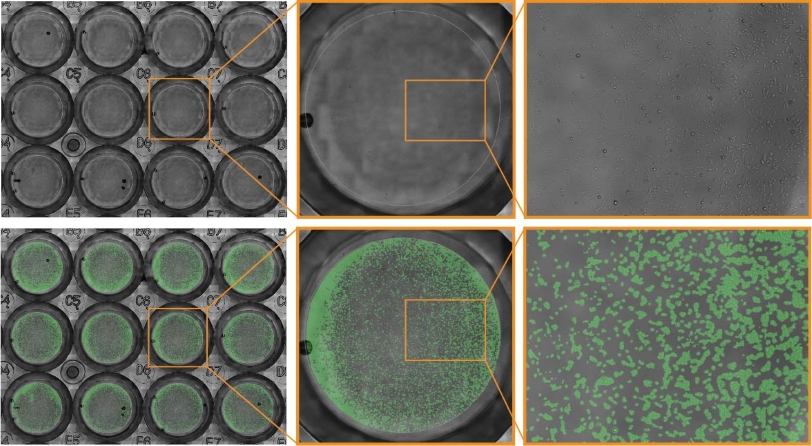
JnHEK cells were seeded in a 24-well plate and monitored on the Omni platform. The integrated Cell Confluency Module was used to calculate JnHEK proliferation at each time point.
Result: Cell growth was continuously monitored by the Omni, showing an increase in the total cell confluency, especially around the edges of the wells.
Purpose: To establish the optimal seeding density of tested cancer cell lines. Seeding density can impact the proliferation and viability of cells.
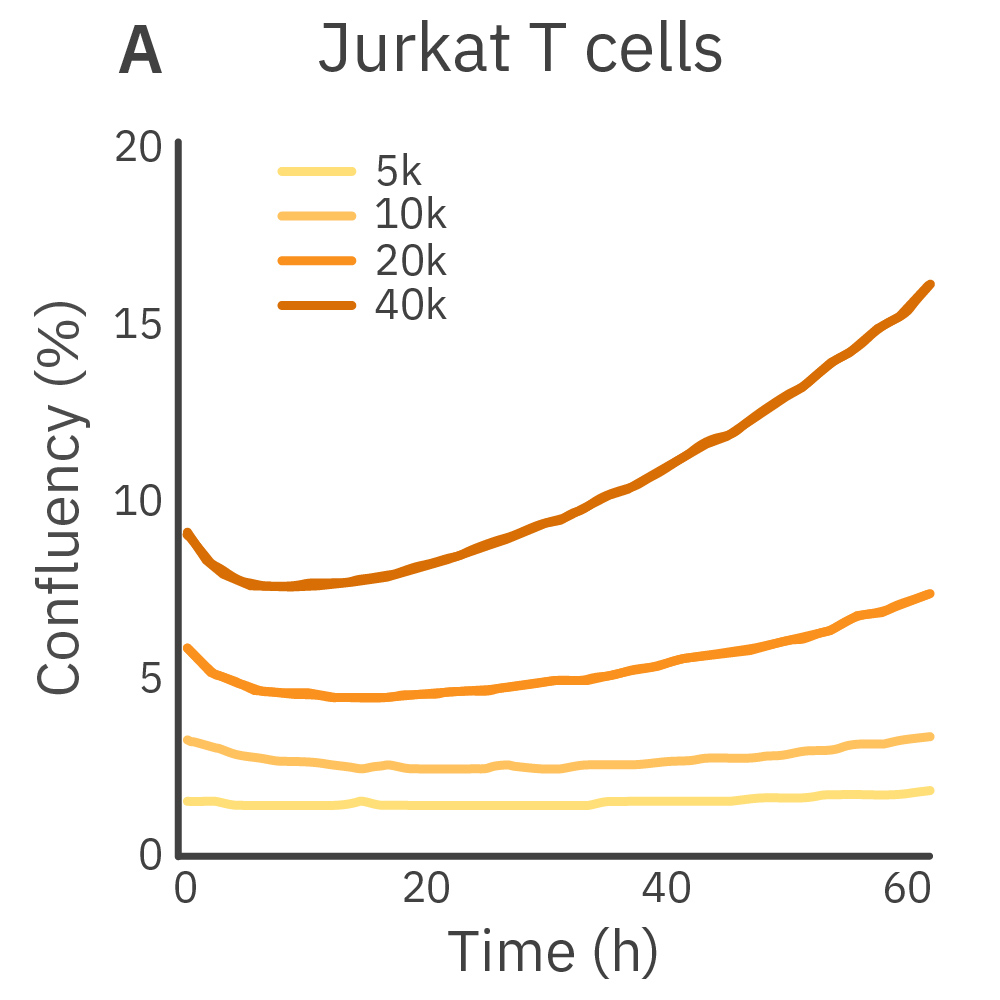
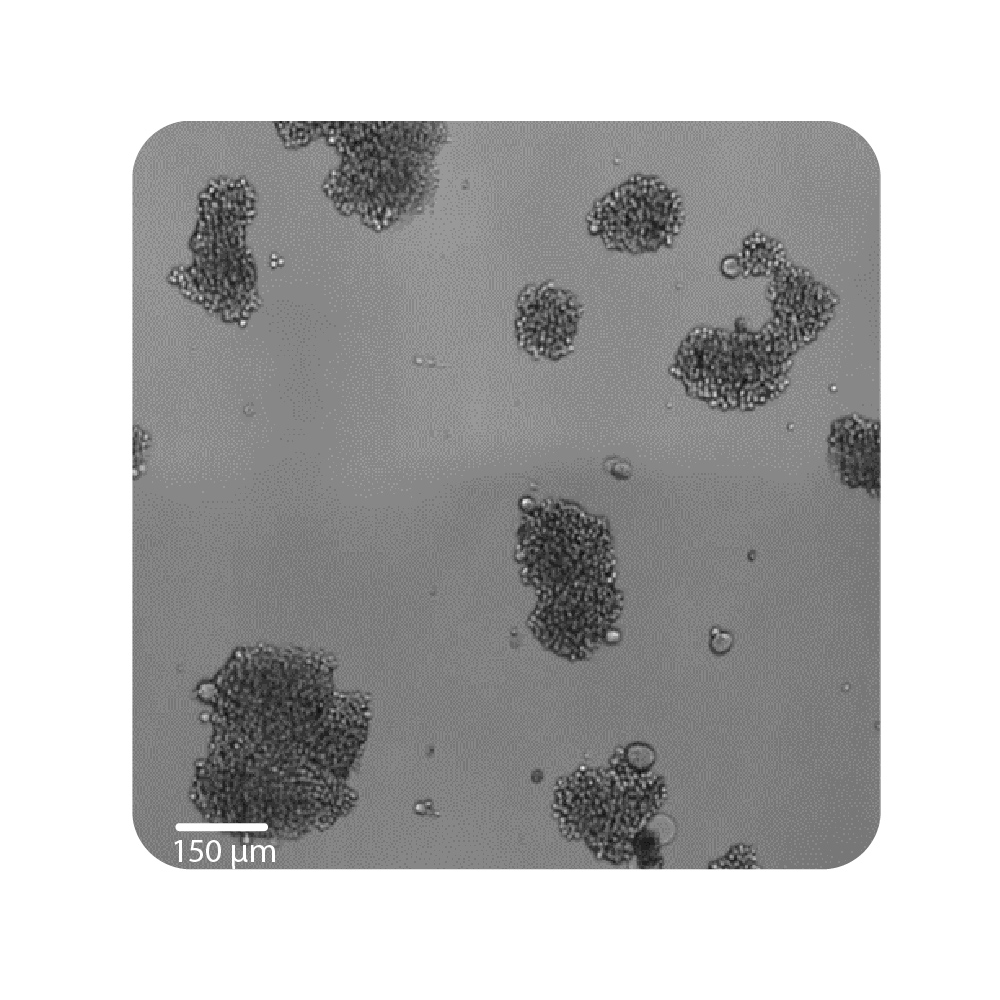
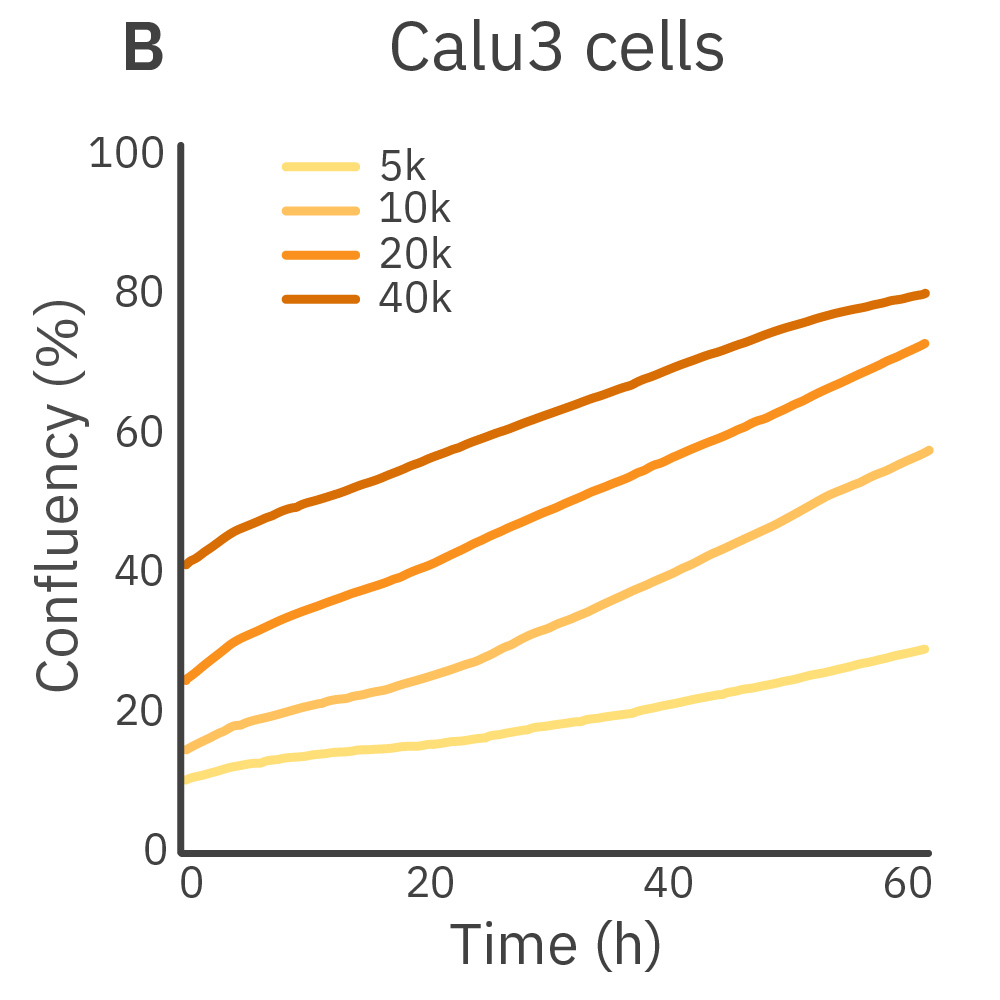
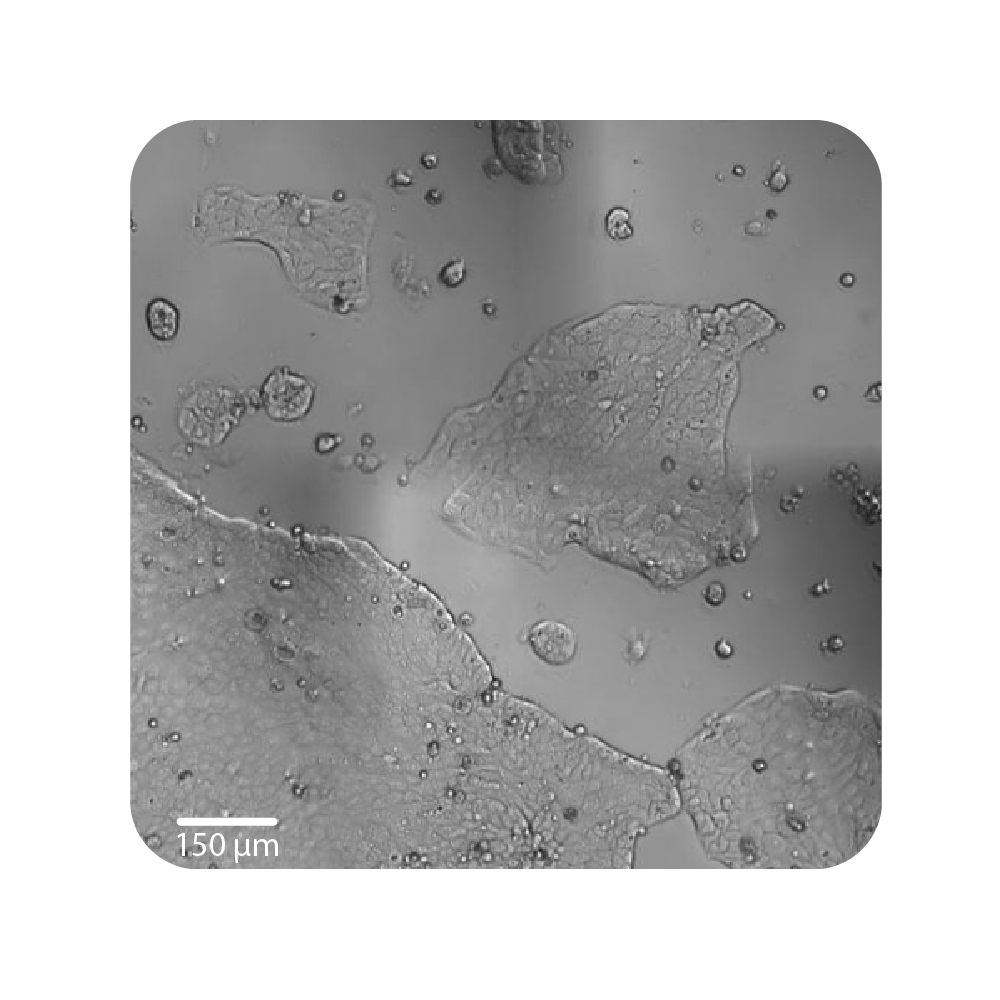
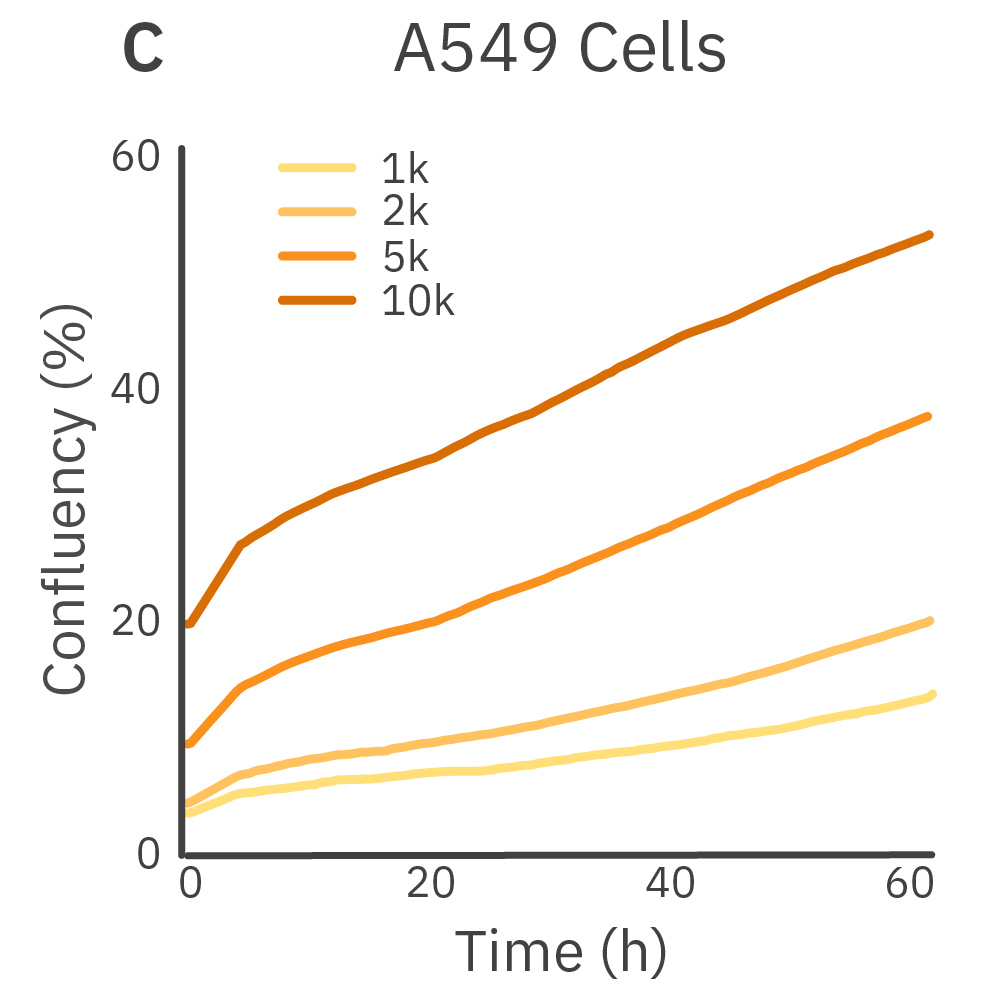
Jurkat T cells, Calu-3, and A549 cells were seeded at various seeding densities and monitored on the Omni platform. The integrated Confluency Module enabled automated analysis of cell proliferation at multiple time points.
Result: Suspension cells and adherent cells that grow in clusters, such as Jurkat T cells and Calu-3 cells, respectively, benefit from higher seeding densities. On the contrary, non-clustering cells, such as A549 cells, benefit from lower seeding densities.
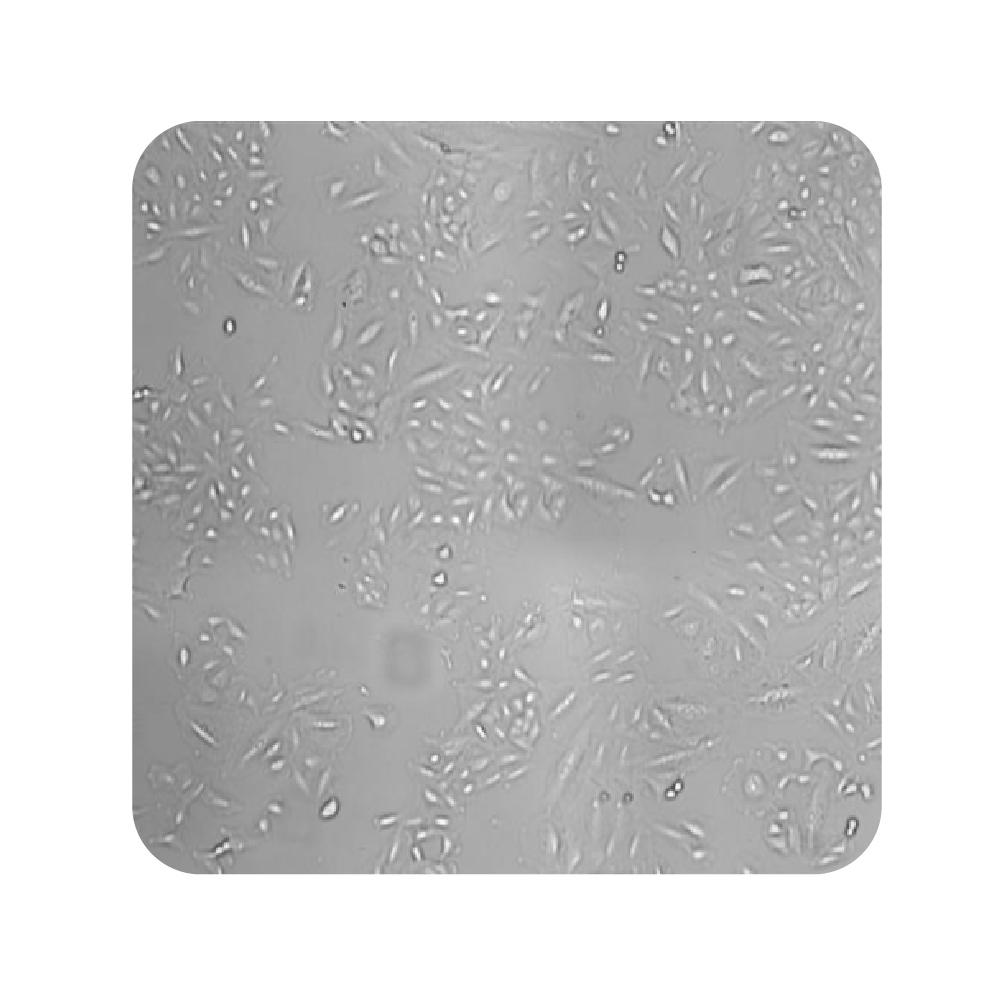
Purpose: To monitor the proliferation of different cancer cell lines. Different cell lines exhibit different patterns of growth and cell behavior that form their unique cellular profile.
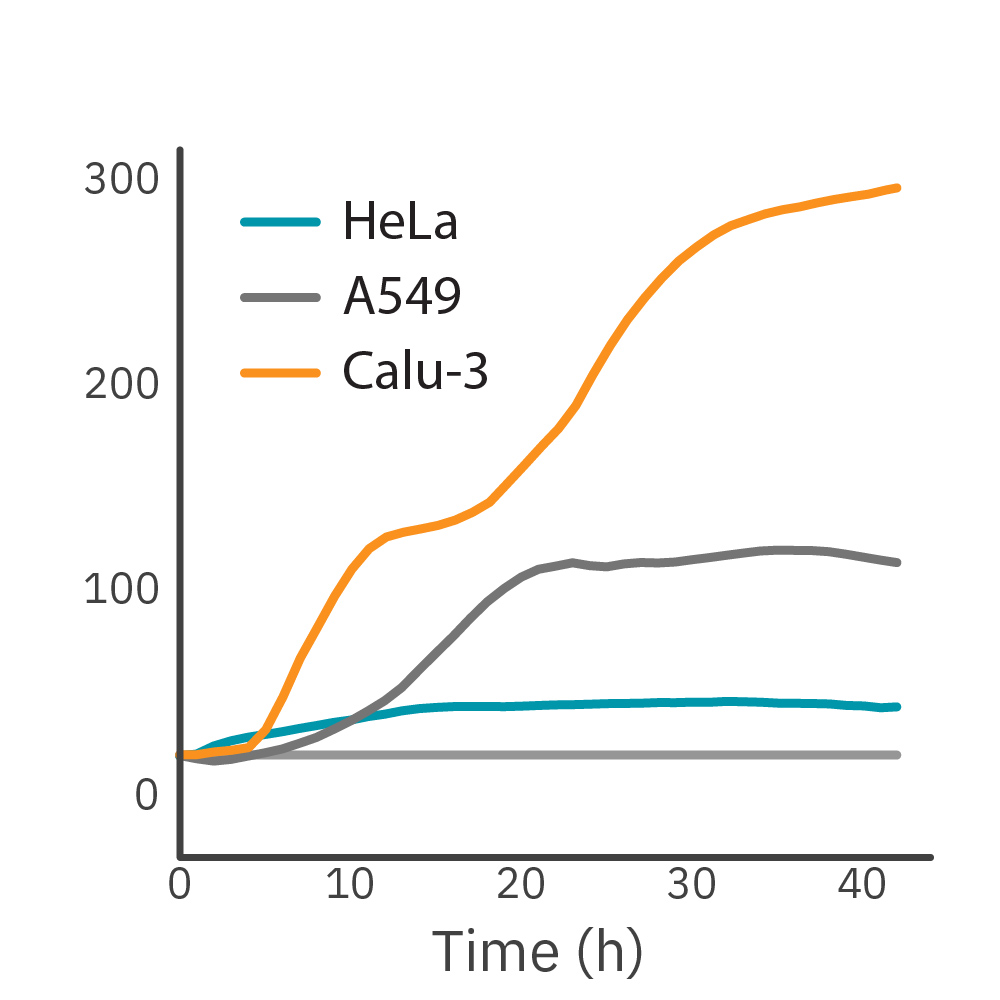
HeLa, A549, and Calu-3 cells, seeded at their optimal seeding densities, were monitored on the Maestro Z system.
Result: Impedance-based growth curves for HeLa, A549, and Calu-3 cells show distinct cellular profiles. HeLa cells reached confluency faster than other cell types while exhibiting the lowest maximum impedance due to cells’ morphology. Calu-3 cells exhibited a slower growth rate as compared to HeLa cells, whereas the growth profile of A549 cells showed an intermediate growth rate.
Purpose: To monitor growth of iPSC cultures. Optimal cell maintenance and expansion of stem cell cultures requires careful monitoring to passage cells at the right density.

Human iPSCs were cultured in a 6-well plate. Stem cell imaging was performed using the Omni™ platform over the course of 72 hours. The iPSC Module was used to calculate iPSC coverage, colony count, average colony area, and diameter at each time point.
Result: The Omni tracked iPSC colonies as they grew in size and the culture increased in density. By Day 3, iPSC growth was accelerating, as indicated by the rapid coverage and area increase from Day 2, nearing the time to passage.