Abstract
Synaptic connections are a fundamental building block of neuronal function, enabling the propagation of activity from one neuronal circuit to another. However, traditional in vitro neuronal models comprise a single neuronal circuit, whereas animal models are too costly and complicated to facilitate an assay on synaptic propagation. Here, we describe the development and characterization of a simple in vitro assay of synaptic propagation between two distinct neural circuits. A two-compartment insert was used to seed spatially distinct populations of rodent cortical neurons in each well of a 6-well MEA plate. After the insert was removed and the cultures matured, functional synaptic connections formed between the two populations, allowing bursts of coordinated activity between the two populations. One population was transduced with ChR2, a depolarizing optogenetic channel, and stimulated with blue light to evoke activity, while the other population served as the “readout” to quantify synaptic propagation. The wells were dosed with a cocktail of synaptic blockers, highlighting the ability of the assay to resolve changes in synaptic propagation.
Materials
Cells and Reagents
Primary Rat Cortex Neurons (RNC) cells were obtained from Thermo Scientific (Waltham, MA). Prepare media using Neurobasal™ Plus Medium (Thermo, cat. No. A3582901), B-27™ Plus Supplement (50X) (Thermo, cat. No. A3582801), and 1% PenStrep (Gibco, cat. No. 15140122).
Microplate Consumables and Instrumentation
Well Divider Inserts (Ibidi, cat. 80209) were installed on the CytoView MEA 6-well plate. Axion's Cytoview MEA 6-well has 64 recording electrodes embedded in the culture surface of each well.
Methods
CytoView MEA 6-well plate Preparation
The two-compartment insert was removed from the packaging and placed on the MEA surface in the each well of the CytoView MEA 6- well plate, such that the center line was over the middle of the microelectrode array. Each compartment of the insert was filled with 50 µL of PDL solution (0.01%), then rinsed four times with diH2O and dried.
Cell Culture
RNCs were thawed and cultured according to the supplier recommendations. Cell density and viability was determined using a hemocytometer. The cell suspension was transferred to a 15 mL conical tube and centrifuged at 100xg for 1 minute. The supernatant was aspirated, being careful to not disturb the cell pellet. Neurons were resuspended at a concentration of 10,000,000 neurons/ml and the suspension was divided into two tubes for the transduction step. A 5 µl droplet of the RCN suspension was placed over the recording electrode area on each side of the insert in each well of the MEA and incubated for one hour at 37°C, 5% CO2 then 100 µL medium was added to each compartment. The insert was removed after 48 hours, the well filled to 500 µL of media, and then maintained by exchanging 50% of the medium every 2-3 days.
Optogenetic Transduction of RCNs
Neurons on one side of insert were transduced to induce expression of Channelrhodopsin (ChR2), a blue light-sensitive opsin, via an AAV-9 viral vector and CAG promoter (rAAV9/CAG-ChR2-GFP, 4.1x10^13 viral molecules/mL). The viral vector (3 µL of virus stock) was added to one of the cell suspension tubes prior to plating.
Optical Stimulation
Optical simulation was applied with the LUMOS 96 optical stimulation device and operated by AxIS Navigator Stimulation Studio. The Lumos applied blue light pulses at 2% of maximum power at a frequency of 0.5 Hz for two minutes.
Results
Two Compartment Insert Facilitates Functional Connection Between Distinct Neuronal Networks
Silicone inserts with two compartments were added to each well of a CytoView MEA 6-well plate. Cortical neurons were seeded into each of the compartments and cultured for two days. At two days in vitro, the insert was removed, such that axonal projections could cross the cell-free gap and establish functional connections between the two distinct cortical networks.
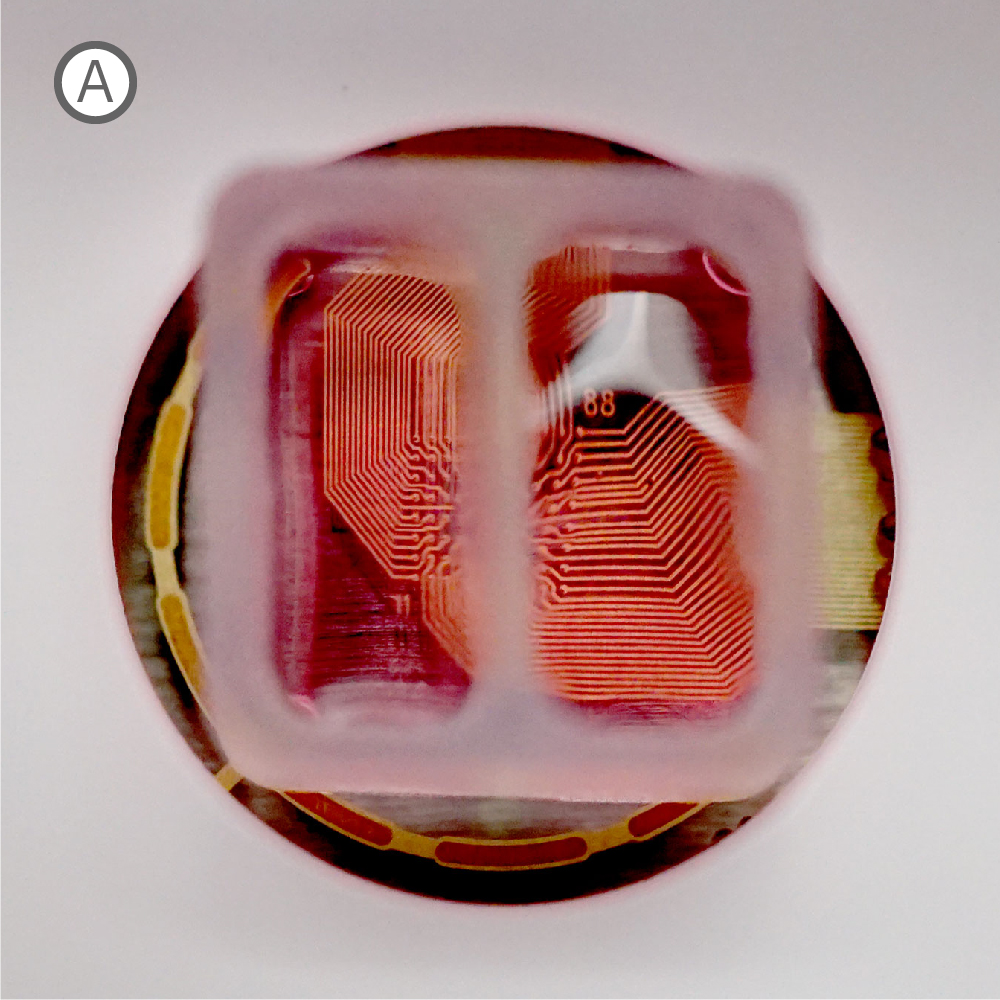
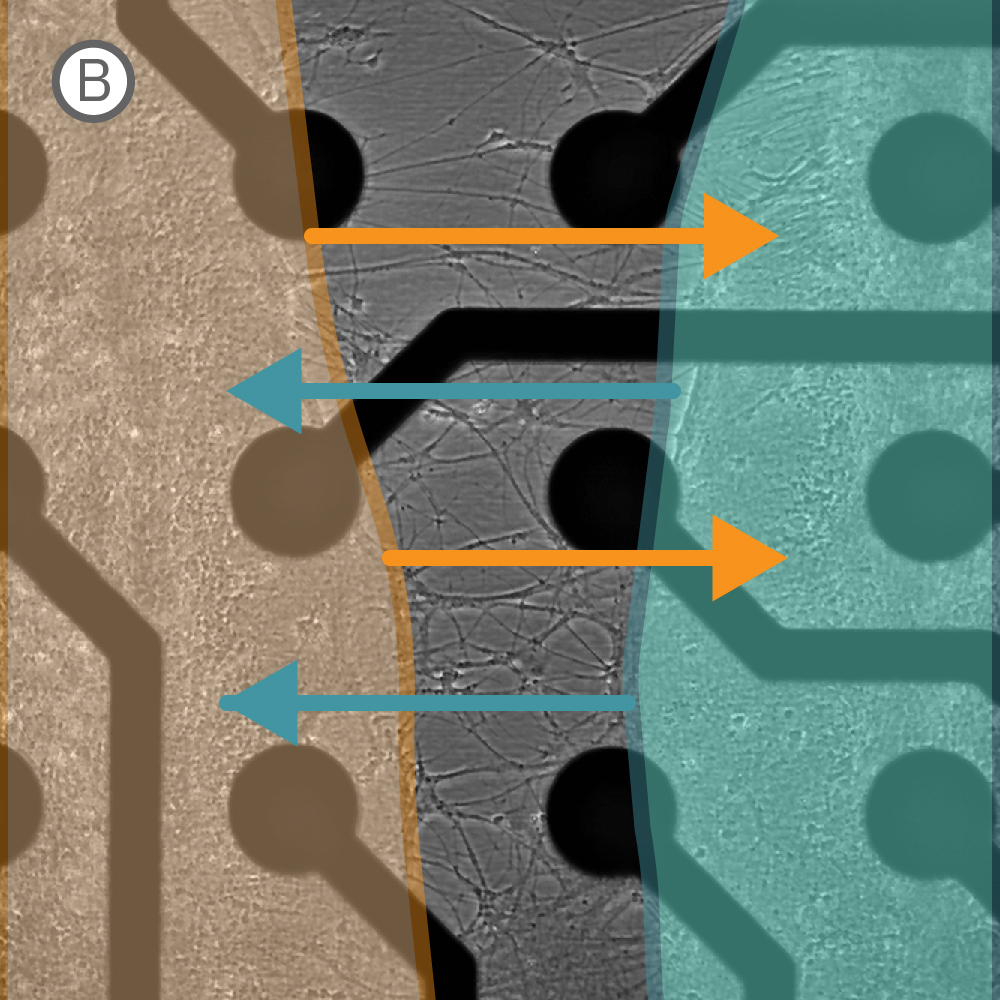
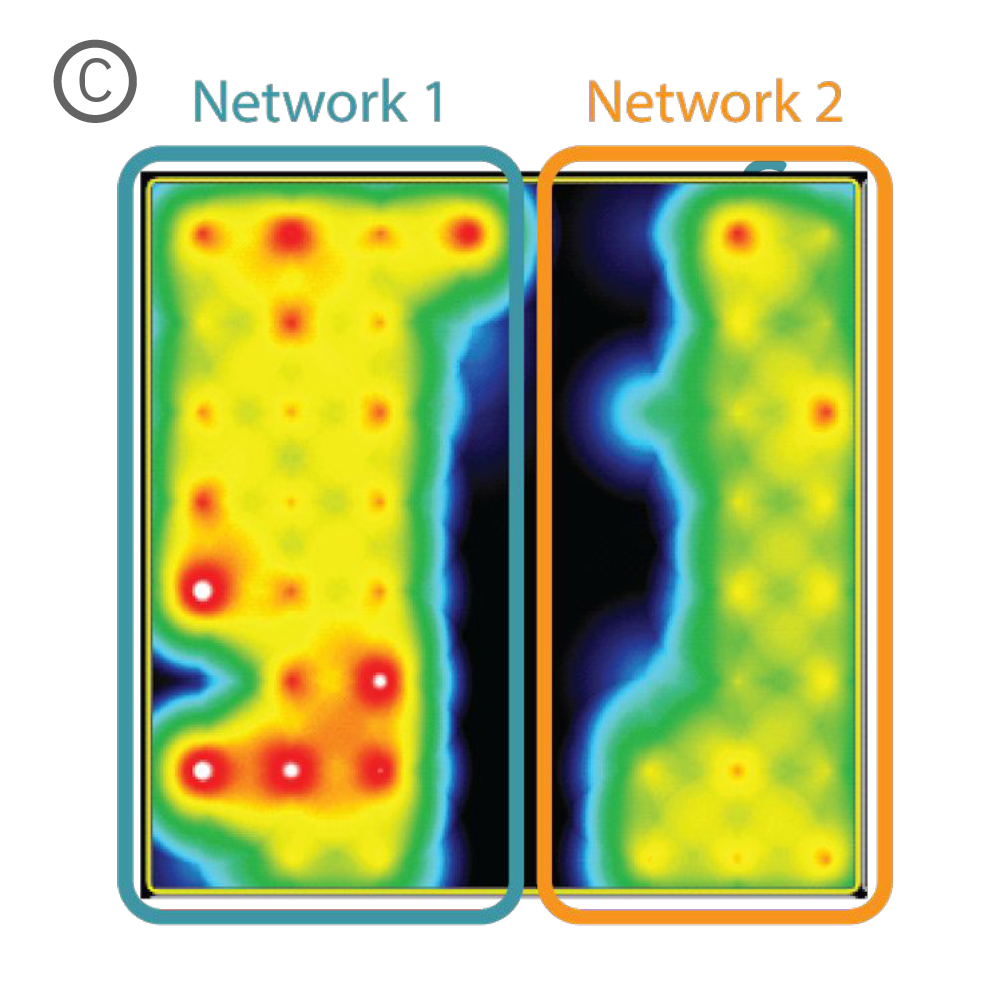
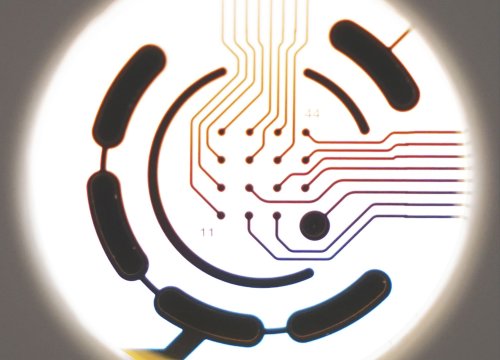
Figure 1: A) Two compartment silicone insert. B) Axonal projections cross the cell-free gap within 10 days of removing the insert. C) Activity map illustrating synchronous activity between the two spatially separated networks
An illustrative example from a single well on the plate is shown in Figure 1. The insert divides the well into two compartments over the array, as shown in Figure 1A. An optical image of the well confirms that axonal projections have crossed the gap within 10 days of removing the insert (Fig. 1B), and the activity map indicates synchronous activity between the two networks (Fig. 1C).
Evoked Assay of Synaptic Propagation
The initial spatial separation of the neural networks allowed genetic modification of each network independently. By ~17 days in culture, the transduced population was responsive to light stimulation, and the functional synaptic connections propagated the evoked activity to the other network. An example of the data collected from the evoked assay is provided in Figure 2 below.
The cartoon in Figure 2A depicts the two spatially distinct networks: the optically “evoked” network (orange) and the “readout” network (teal). Each pulse of light (black triangles) elicited a burst of activity in the well across the two networks (Figure 2B). The peri-stimulus raster in Figure 2C shows that the activity begins in the “evoked” network, and then propagates, after a delay, to the “readout” network. Thus, the well divider and optogenetic simulation provide an assay platform for investigating pharmacological mediation of synaptic transmission between two cortical networks.
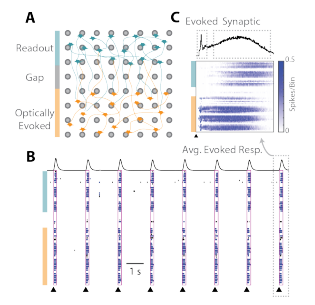
Figure 2: Connection between two cortical networks formed after the well divider was removed. (A) The “evoked” network is sensitive to optical stimulation, whereas activity in the “readout” network is dependent on synaptic propagation. (B) Raster plots indicate synchronous activity after optically stimulation and (C) the average evoked response denotes an initial evoked response followed by a flurry of synaptically mediated activity.
Pharmacological Control of Synaptic Propagation
The RCN cultures contain both of excitatory and inhibitory neurons, therefore a combination of NMDA, GABA, and AMPA receptor antagonists were used in combination. APV (50 µM), Bicuculline (20 µM), and CNQX (20 µM) were delivered to the wells together as a cocktail. The evoked assay was performed, as described in Figure 2, in baseline, dosed, and washout conditions, under vehicle and cocktail treatments. The raster plots from an example well qualitatively show that the addition of the cocktail prevented the evoked input from propagating to the “readout” network, but propagation was then restored following washout (Figure 3).
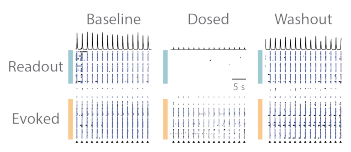
Figure 3. Propagation of evoked activity is reversibly blocked by pharmacological treatment. (A) Prior to pharmacological treatment synaptic activity between the “evoked” and “readout” networks is robust and synchronous. (B) Pharmacological treatment caused a small decrease in the activity of “evoked” network after stimulation, and severed the synaptic propagation from the “evoked” to “readout” network. (C) Washout of pharmacological agents restored synaptic communication within and between both cortical networks.
The activity of the “evoked” and “readout” networks was analyzed separately to illustrate the effect of the synaptic blocker cocktail. The number of bursting electrodes tracked the degree to which each network was entrained to the stimulus. Before the cocktail was applied, the majority of the electrodes detected burst activity for each network (Figure 4). After dosing, the number of bursting electrodes decreased slightly for the “evoked” network, but was not significantly different than the vehicle control. The “readout” network, by comparison, showed a significant reduction in the number of bursting electrodes after dosing with the cocktail, as the synaptic propagation was fully quenched. Washout of the cocktail restored the propagation of activity from the “evoked” to “readout” networks, as evidenced by the return of the number of bursting electrodes to baseline levels for the “readout” network.
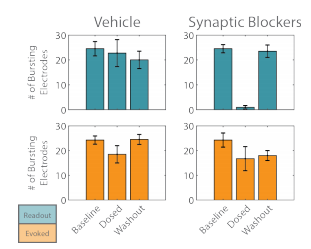
Figure 4. The number of bursting electrodes was used to track the entrainment of each network, “evoked” (orange) and “readout” (teal), to the optogenetic stimulus.
The above analysis was performed according to the spatial separation of the two networks within the well. Similar results are obtained when the latency of the evoked response is considered. Here, the activity from the two networks were analyzed together, but segmented into an early response (0-40 ms) directly evoked by the optogenetic stimulus and a late response (40-100 ms) mediated by synaptic propagation.
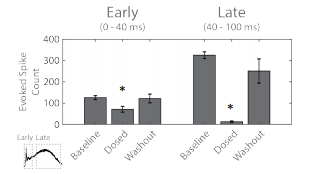
Figure 5. The evoked spike count was used to quantify the early “evoked” (left) and late “synaptic” (right) response to the optogenetic stimulus. Statistical significance (*) relative to baseline.
The evoked spike count was used to quantify the response for each segment of the response. The early response, with directly evoked activity, did decrease after adding the cocktail, indicating the presence of short latency synaptic activity (Figure 5). The peristimulus raster plot from Figure 2C indicates that much of this short latency synaptic activity was within the “evoked” network. The late response, representing synaptic propagation, was significantly reduced after administering the cocktail of synaptic blockers. Notably, the near complete erasure of activity in the late synaptic response indicates blockade of intra- and inter-network synapses.
Conclusion
The Maestro MEA coupled with the ibidi two-compartment insert provide versatile assay platform for interrogating the connection between two neural networks in vitro. The cell types seeded on the MEA, timing of divider removal, and the configuration of the analysis offer flexibility to address a variety of research questions.
For example, the synaptic assay framework presented here provides a new technique for studying neuromuscular junctions or modeling neurodegenerative diseases characterized by aberrant synaptic activity
Keywords: synchrony, disease-in-a-dish, compartmentalized models, cortex, maestro, neural activity, optogenetics